Chapter 3: The Adoption of Remote Work Led to a Redistribution of Employment Towards the Exurbs
Over the last few years, remote work has evolved from a small but significant presence in the US labor market to a defining feature. The Capital Region is no exception to this change, and we examine here how the rise of remote work has influenced employment across urban, suburban, and exurban jurisdictions.
We rely on the Census Bureau’s definition of remote work, which calls someone a remote worker if they responded that they “worked at home” when asked about their usual means of transportation to work in the previous week. Figure 3.1 shows that between 2015 and 2019, the prevalence of remote work in the Capital Region grew slowly and steadily, from 5 percent to 6 percent. This slight upward trend abruptly accelerated with the onset of the COVID-19 pandemic in 2020, as widespread lockdowns and social distancing measures induced many employees to work from home. By 2021, the incidence of remote work peaked at 32 percent, or 5 times the 2019 Capital Region rate.
Figure 3.1: Work from Home is Permanently Higher after the Pandemic
Workers working from home, 100,000s 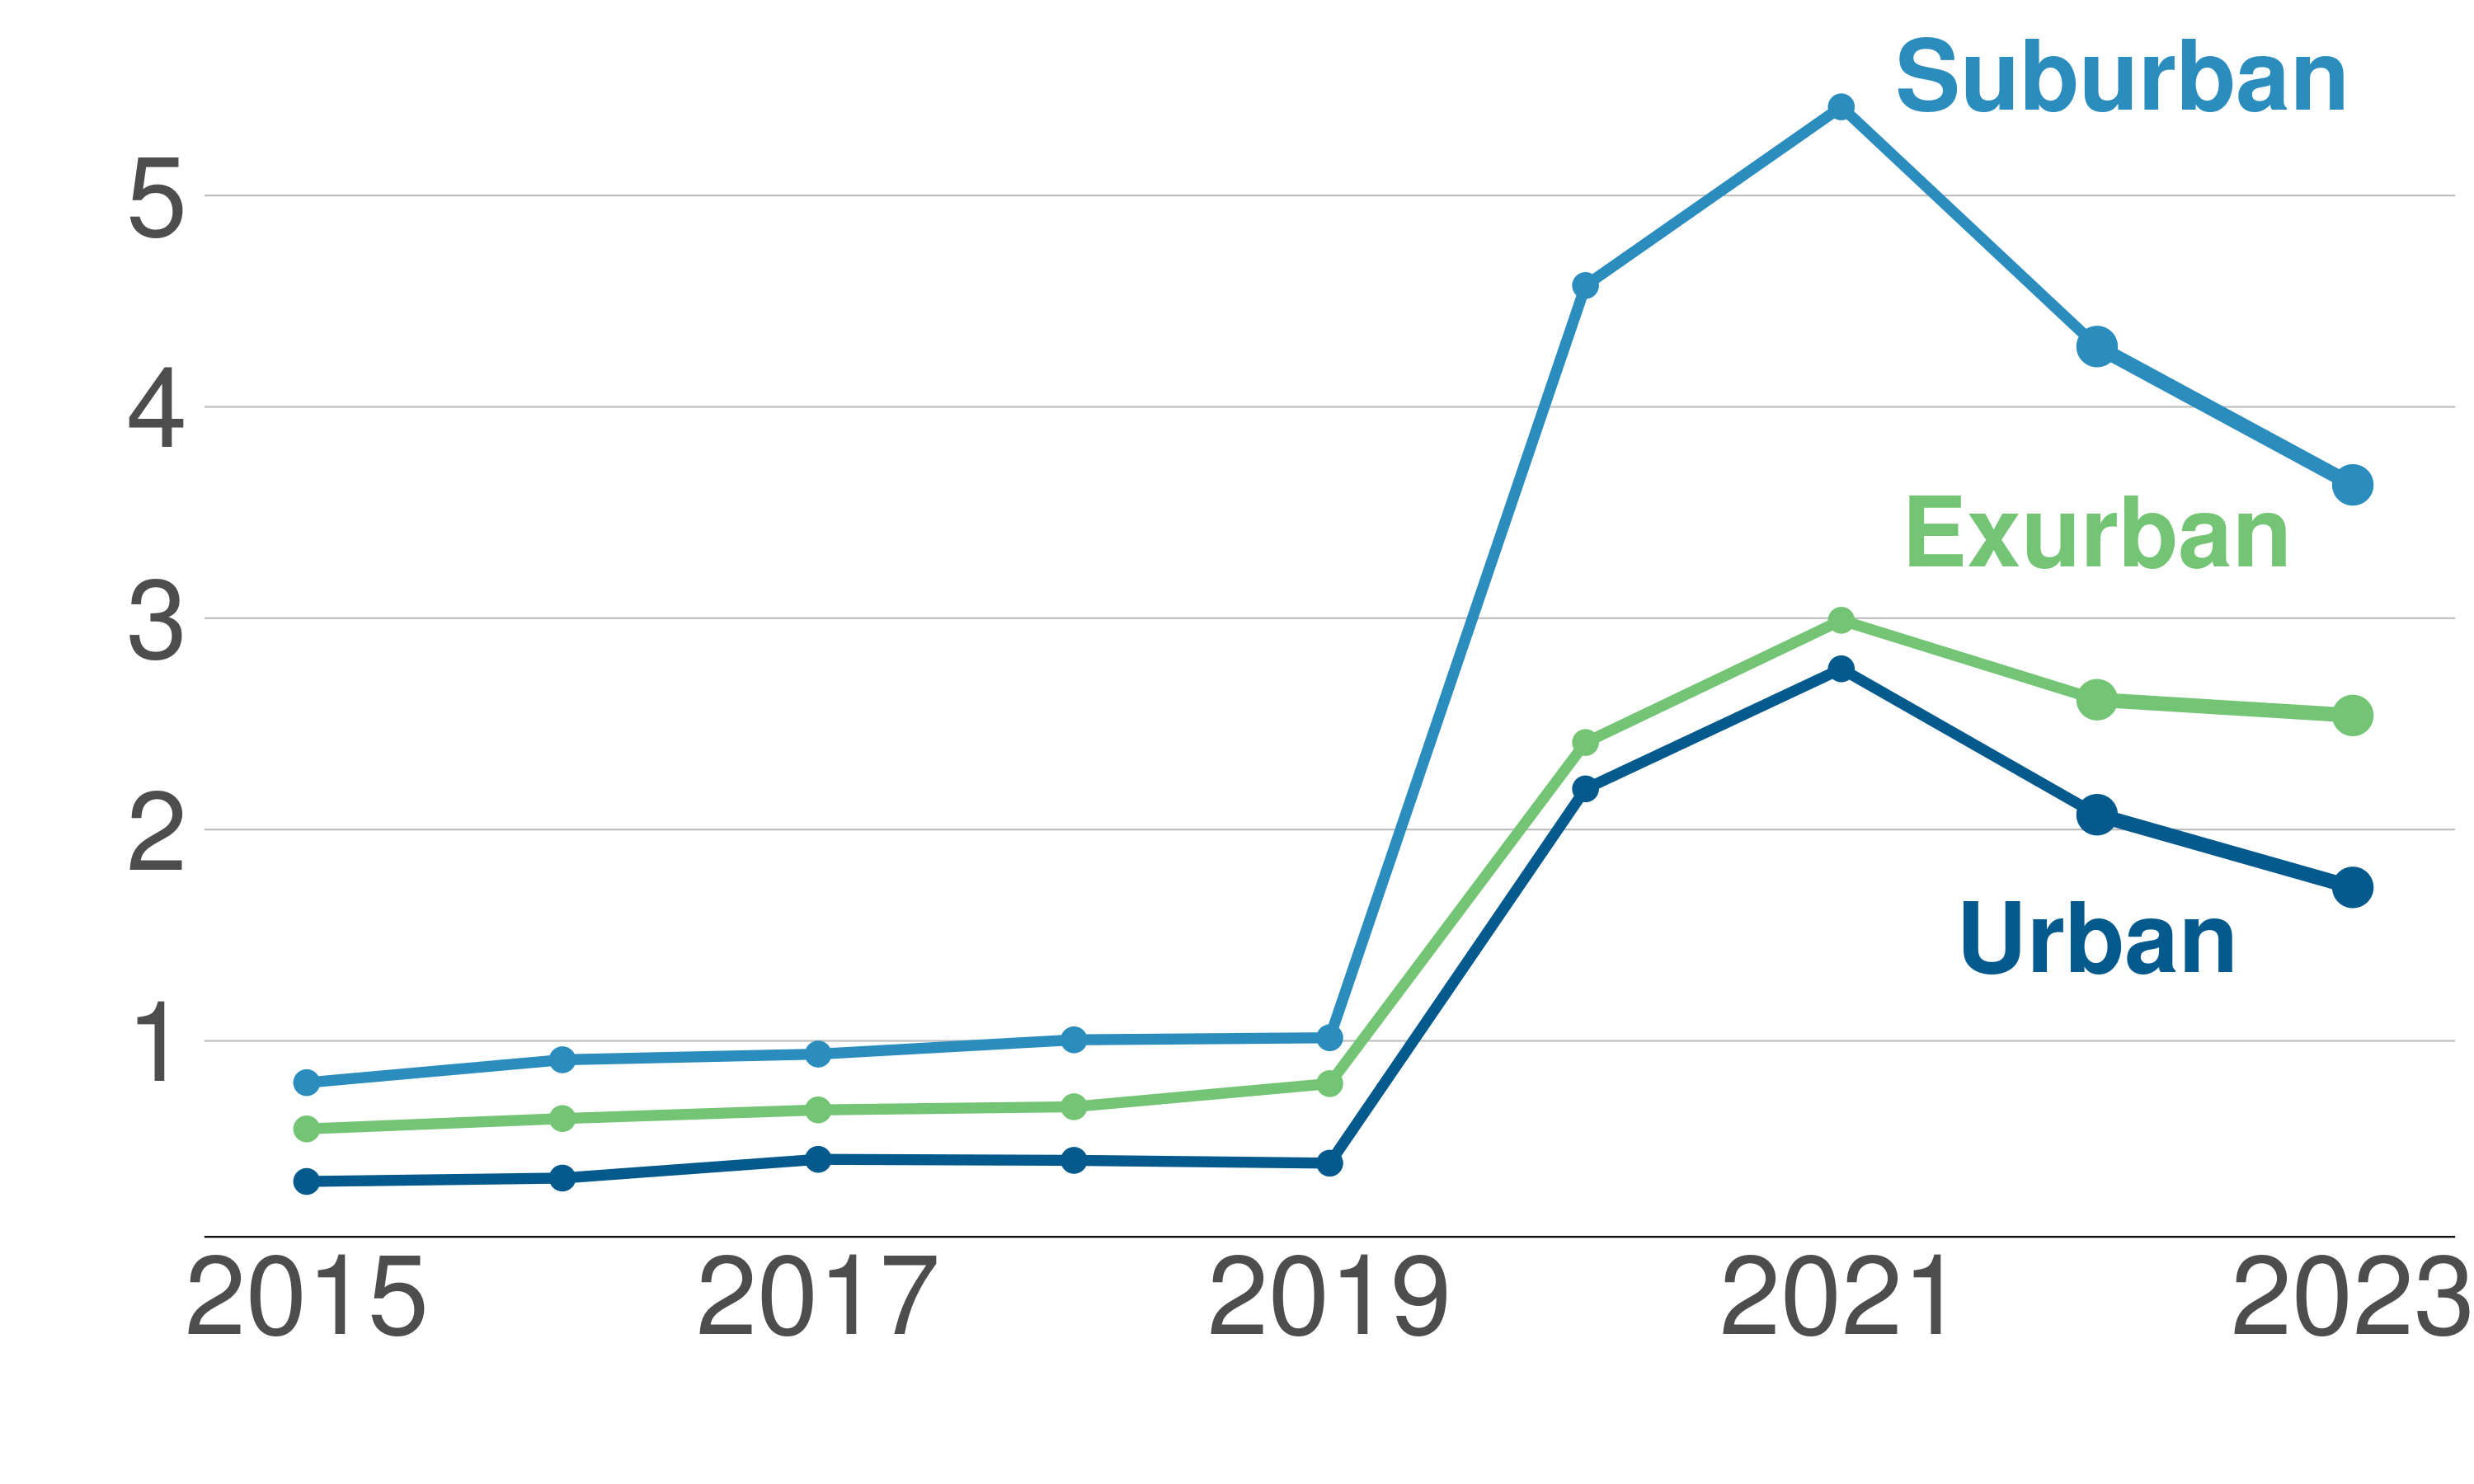
Workers working from home, 2019 equals 100 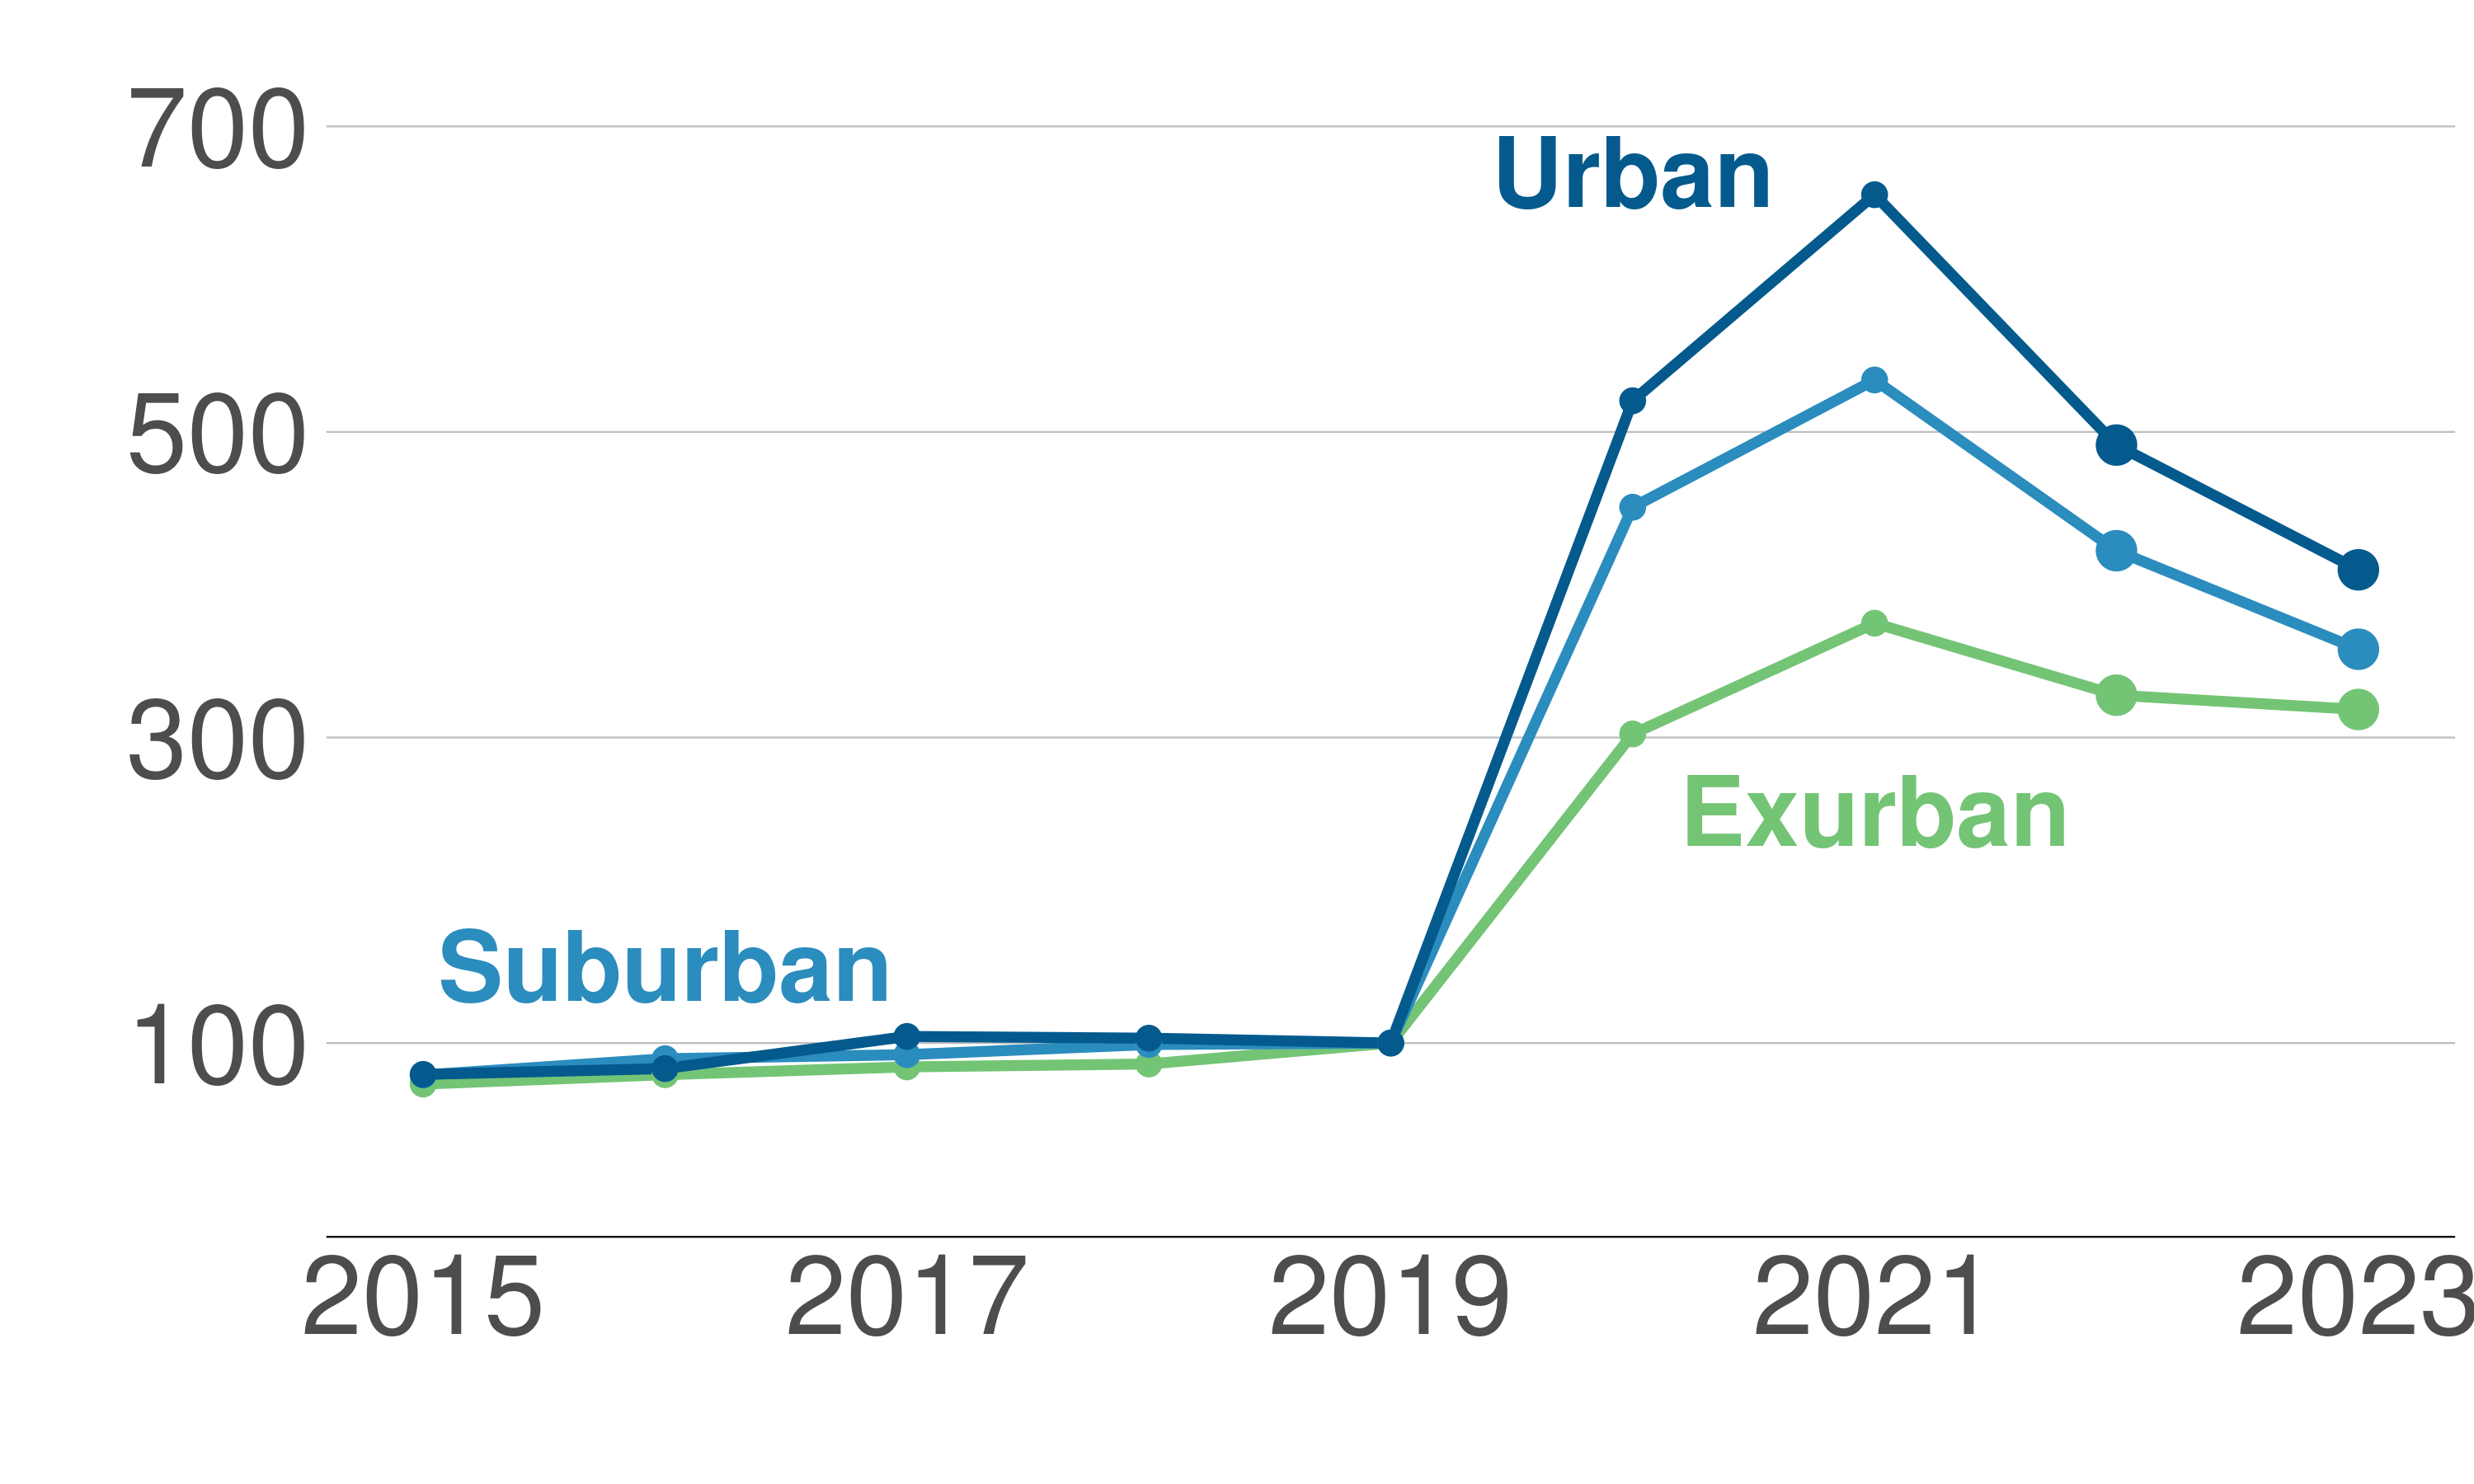
Notes & Sources: Census American Community Survey Public Use Microdata Sample (PUMS), 1-year Estimates for years 2015-2023. For 2020, we use the American Community Survey 2020 experimental data. We use variable JWTR, and use value 11 for work from home. First graph: total number of people working from home by urban, suburban, and exurban jurisdictions in 100,000s.
Although some workers eventually returned to in-person work, the level of remote work in 2023 remains roughly four times higher than pre-pandemic levels. In absolute terms, about 225,000 workers worked from home in 2019 and almost 800,000 worked from home in 2023. Remote workers now account for 21 percent of the region’s total employment. This shift aligns with national survey findings—such as those from Barrero et al., 2021—that find that workers in the Capital Region perform almost one-third of total hours worked at home. Comparable large metro areas, including New York, Los Angeles, and San Francisco, report similar sustained increases in remote work.
The increase in work-from-home arrangements is somewhat more pronounced in urban jurisdictions. As Figure 3.1 illustrates, remote work in urban areas is slightly above four times its 2019 level, while in suburban and exurban jurisdictions, remote work settled at about 4 times the 2019 figure. This means that urban jurisdictions have roughly 125,000 more work-from-home workers in 2023 than in 2019.
In suburban jurisdictions, the analogous total increase is about 250,000, while in exurban regions, 170,000 more workers are at home in 2023 relative to 2019. Urban jurisdictions may have had larger increases in remote work because these workers are in occupations or sectors, such as professional services, that are more amenable to work-from-home.
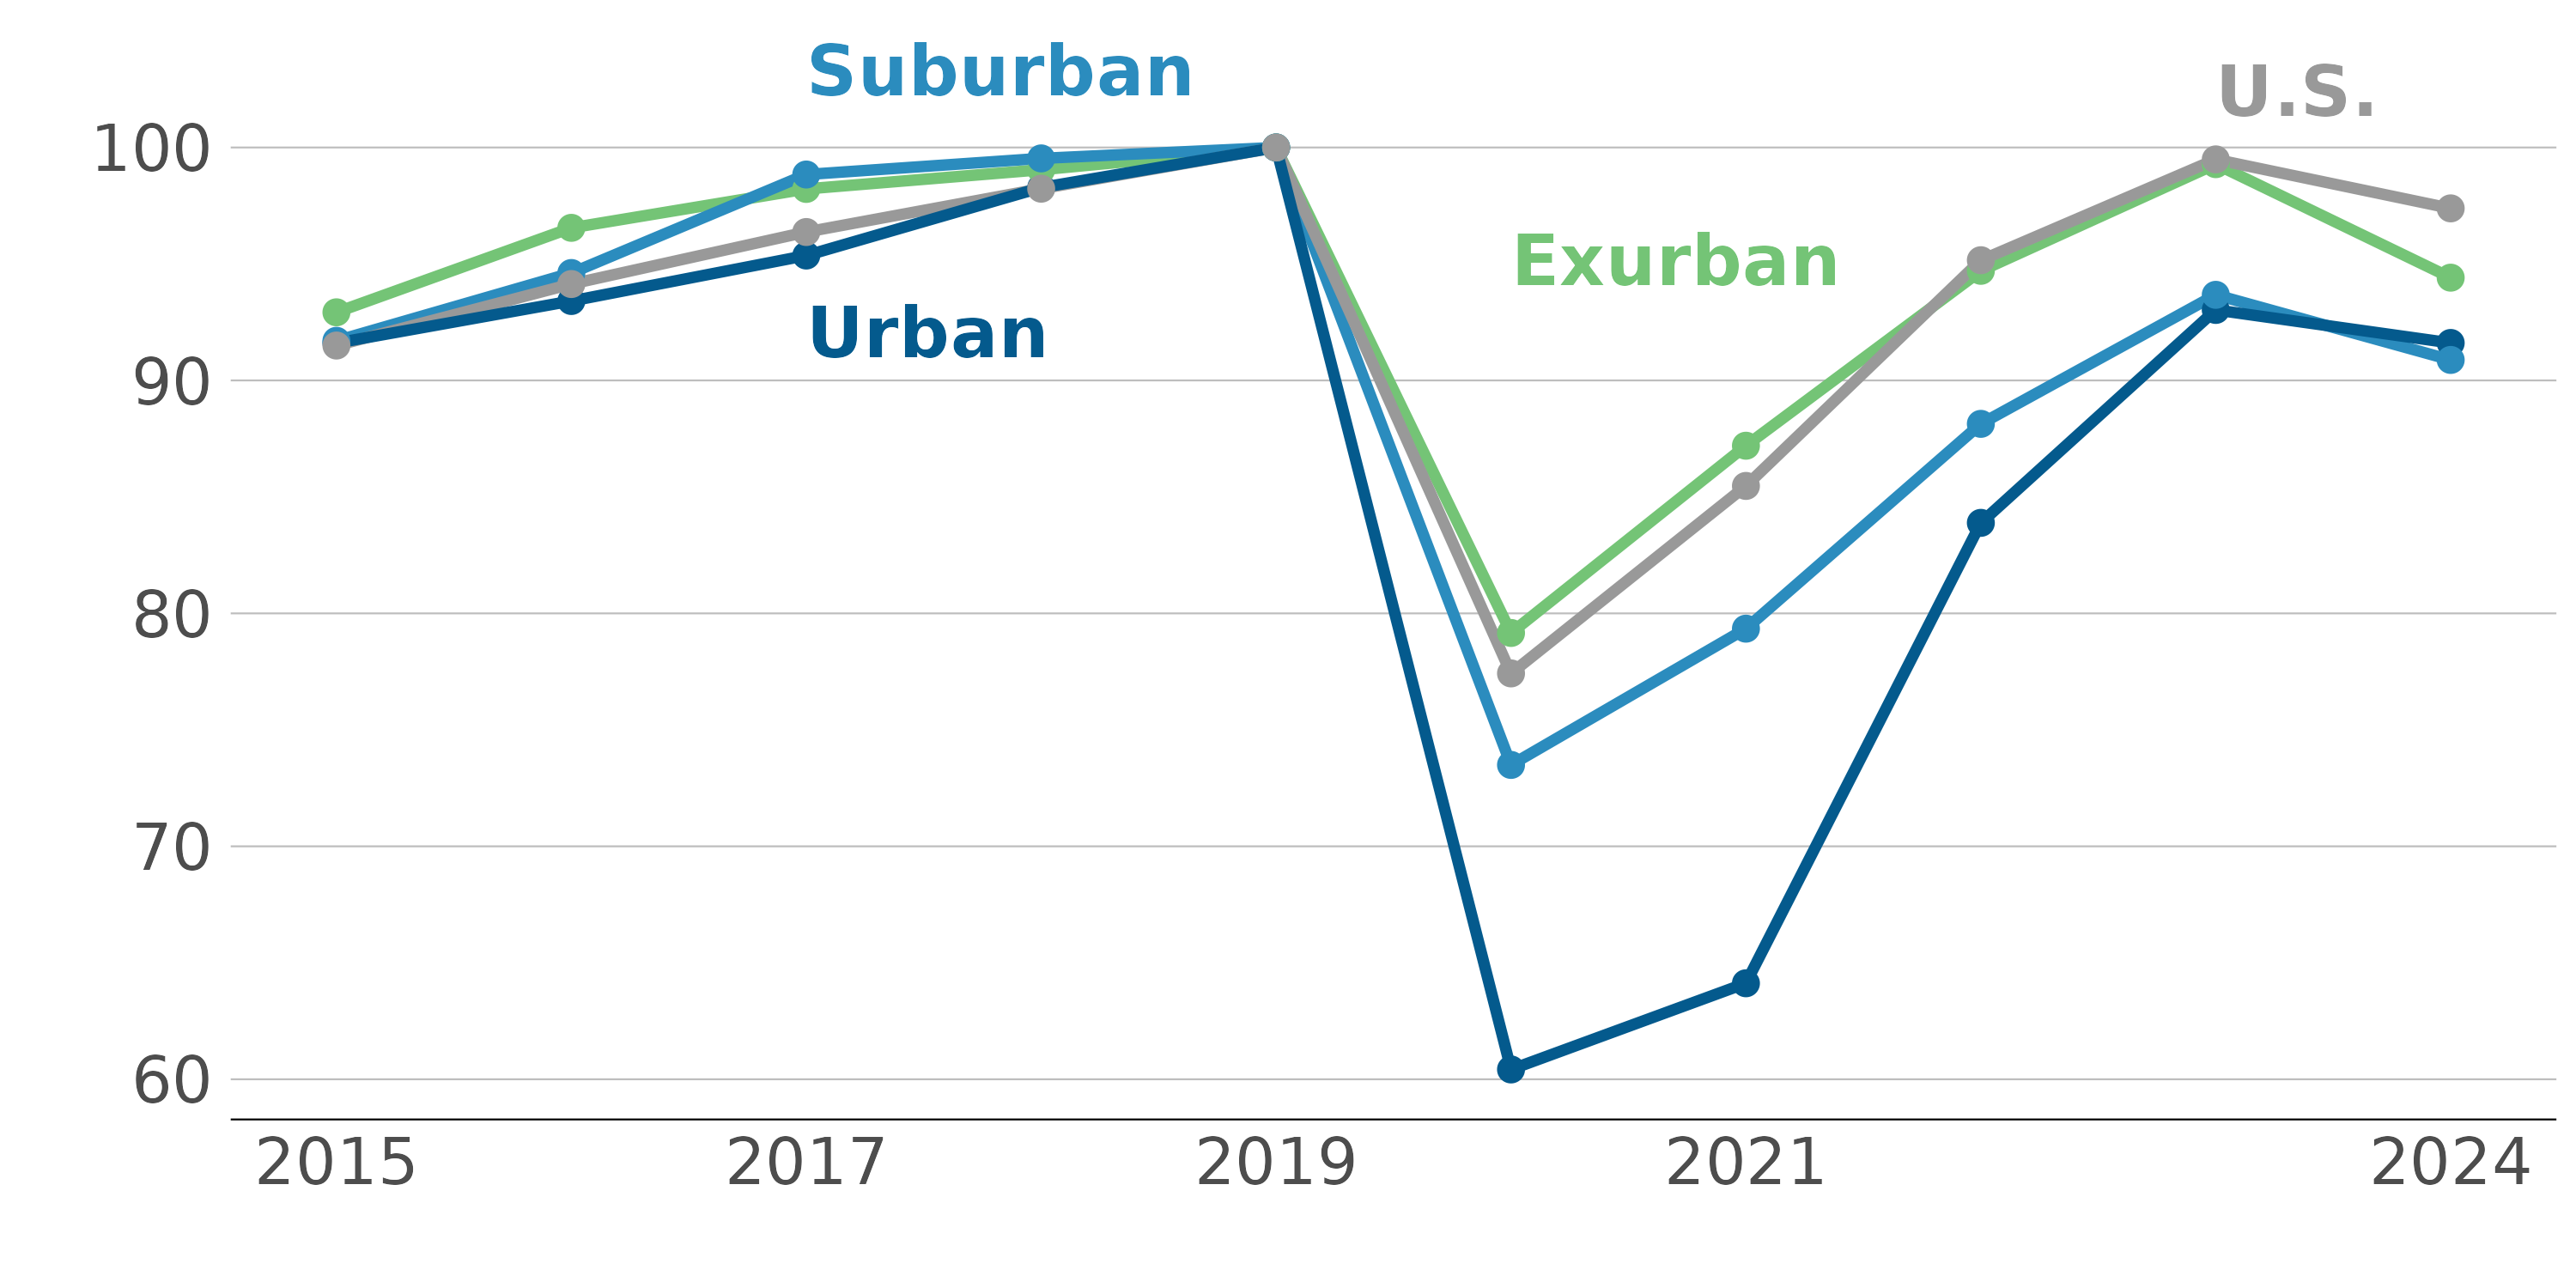
COVID-19-induced lockdowns and social distancing measures particularly affected firms that rely on foot traffic and in-person consumption. Figure 3.2 focuses on the hospitality industry—think restaurants—and illustrates how an increase in working from home may translate into lower demand for hospitality services.
Three findings stand out. First, as the pandemic broke out, employment in hospitality declined sharply. Stay-at-home orders and the concomitant rise in remote work during the pandemic decreased visits to traditional employment centers and associated decreased commuter foot traffic nearby.
Second, the relative attractiveness of urban areas appears permanently altered, even as pandemic conditions eased. Hospitality employment in exurban jurisdictions now stands at about 94 percent of its pre-pandemic level, roughly in line with U.S. trends. However, in urban areas, hospitality employment has rebounded to only just over 91 percent of its pre-pandemic level, suggesting a persistent shortfall in demand.
Third, total hospitality employment in the Capital Region has not recovered to the pre-pandemic steady growth from 2015 to 2019, mirroring national patterns. This enduring slowdown likely reflects the broader shift toward working from home, which has reduced midday and post-work patronage for businesses that traditionally catered to on-site employees.
Figure 3.2: The hospitality sector lost more employment in urban and suburban areas
Hospitality employment in urban, suburban, exurban areas, and the U.S., normalized to 100 in 2019, 2015-2024
Notes & Sources: Quarterly Census of Employment and Wages (QCEW), 2015-2024. We use Hospitality Employment by year.
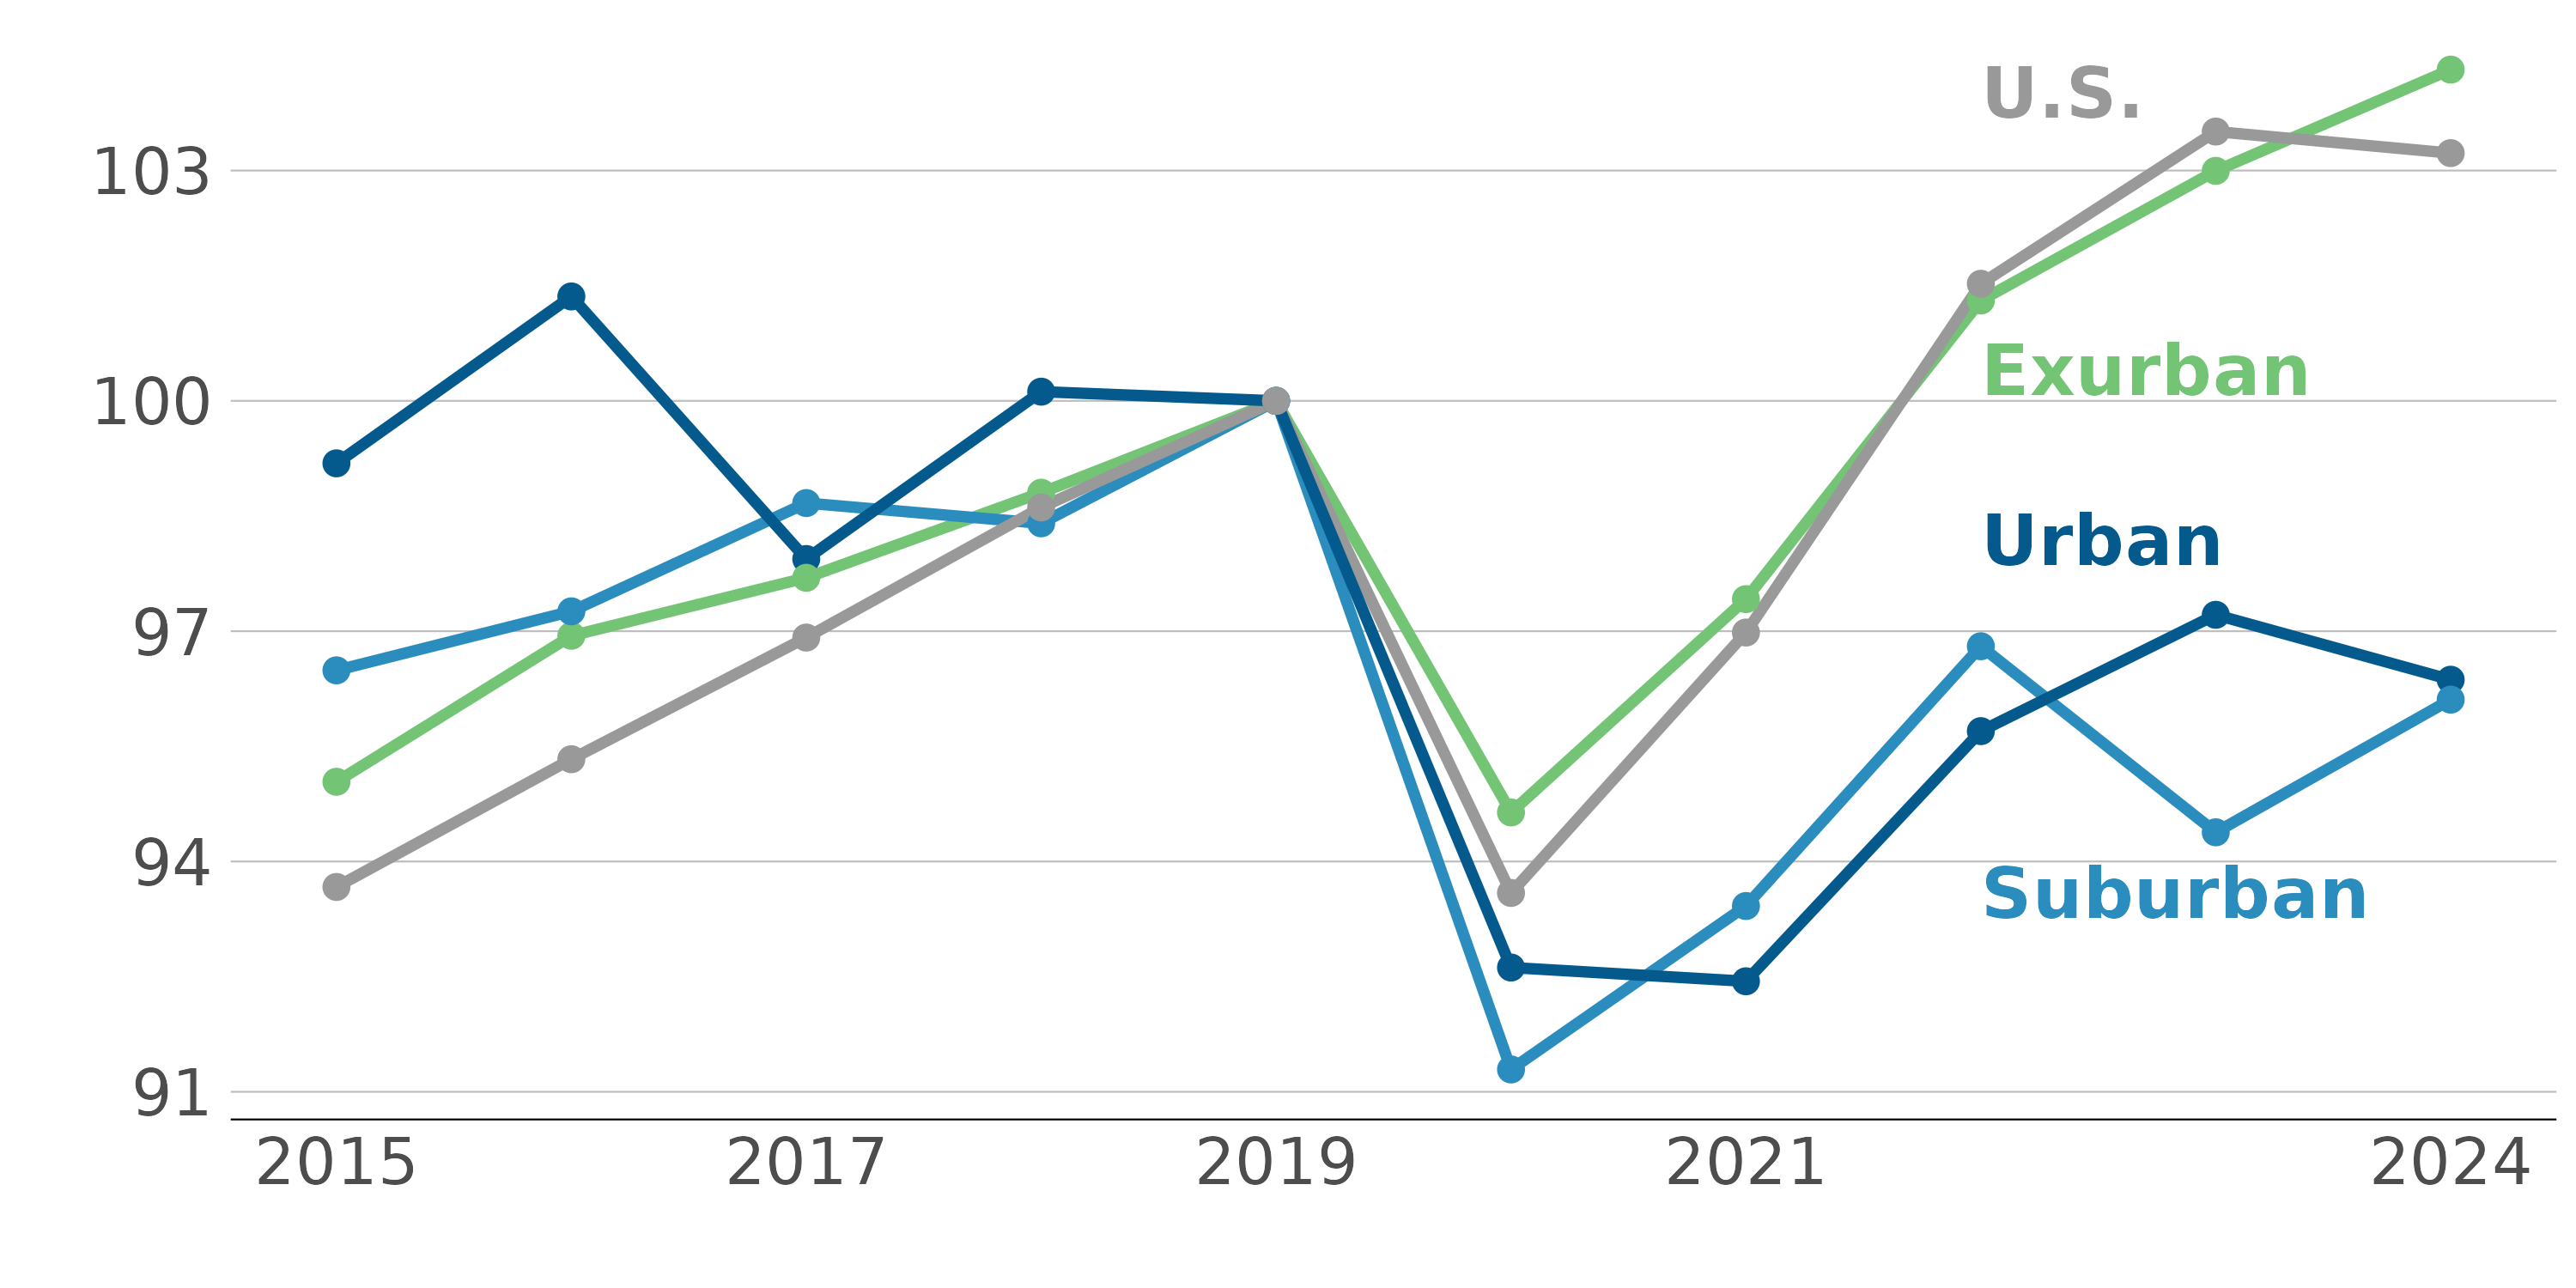
This geographic reconfiguration of economic activity holds beyond hospitality. Figure 3.3 broadens the lens to total employment by area type, and shows patterns over time, again relative to 2019. In the wake of the pandemic, urban and suburban areas saw employment declines slightly under 9 percent. Notably, these areas have yet to return to the employment growth they enjoyed pre-pandemic. In late 2024, overall urban and suburban employment stood at about 96 percent of its 2019 level.
Exurban areas, on the other hand, experienced a milder 5 percent dip in total employment. Importantly, employment growth in exurban areas seems to have returned to its pre-pandemic rate in these places, reinforcing the notion that some economic activity may have migrated outward. This move would be in line with the residential shifts we document in Chapter 2, induced by remote-work flexibility.
Figure 3.3: Employment shifted towards the Capital Region’s exurbs
Employment in urban, suburban, exurban jurisdictions and the U.S., relative to 2019, 2015-2024
Notes & Sources: Quarterly Census of Employment and Wages , 2015-2024. We use employment by area type and year and US employment by year.
Taken together, these findings suggest that the Capital Region’s labor market has undergone a lasting transformation driven by the rapid adoption of remote work. As a consequence of the rapid and massive adoption of remote-work arrangements, employment may have permanently shifted towards the Capital Area’s exurbs. This shift is broadly consistent with the rent and population trends discussed in Chapters 1 and 2.
In other words, employment patterns appear to mirror the broader reconfiguration of where people live and how they work. With more workers free to work remotely, proximity to large employment centers is no longer the sole driver of residential choice, leading workers and jobs to spread farther from denser urban areas.