Chapter 2: An Ever Greater Share of the Region’s Population Lives in Exurban Jurisdictions
The Capital region has continued to gain residents over the past decade or so, and is now home to some 6.5 million residents. This growth continued even throughout the tumultuous period around the COVID-19 pandemic. The first panel of Figure 2.1 shows that while the region’s urban jurisdictions lost some 50,000 residents between 2020 and 2021, those losses were more than made up for by continued population growth in suburban and, particularly, exurban jurisdictions.
The second panel of Figure 2.1 illustrates these broad developments in a perhaps more striking manner, by focusing on population changes relative to the year 2015. Over that period, the exurban areas grew by just over 10 percent. Suburban jurisdictions grew slowly but steadily, by about 2 percent. Urban jurisdictions are where the pandemic left its mark most clearly, at least in population terms. Urban areas lost 5 percent of their population between 2020 and 2021, and are only slightly more populous now than they were in 2015. The changes after the pandemic entirely erased the relatively fast population growth between 2015 and early 2020.
Figure 2.1: The Capital Region’s Population Has Continued to Grow, Especially in Exurban Jurisdictions
Population in millions 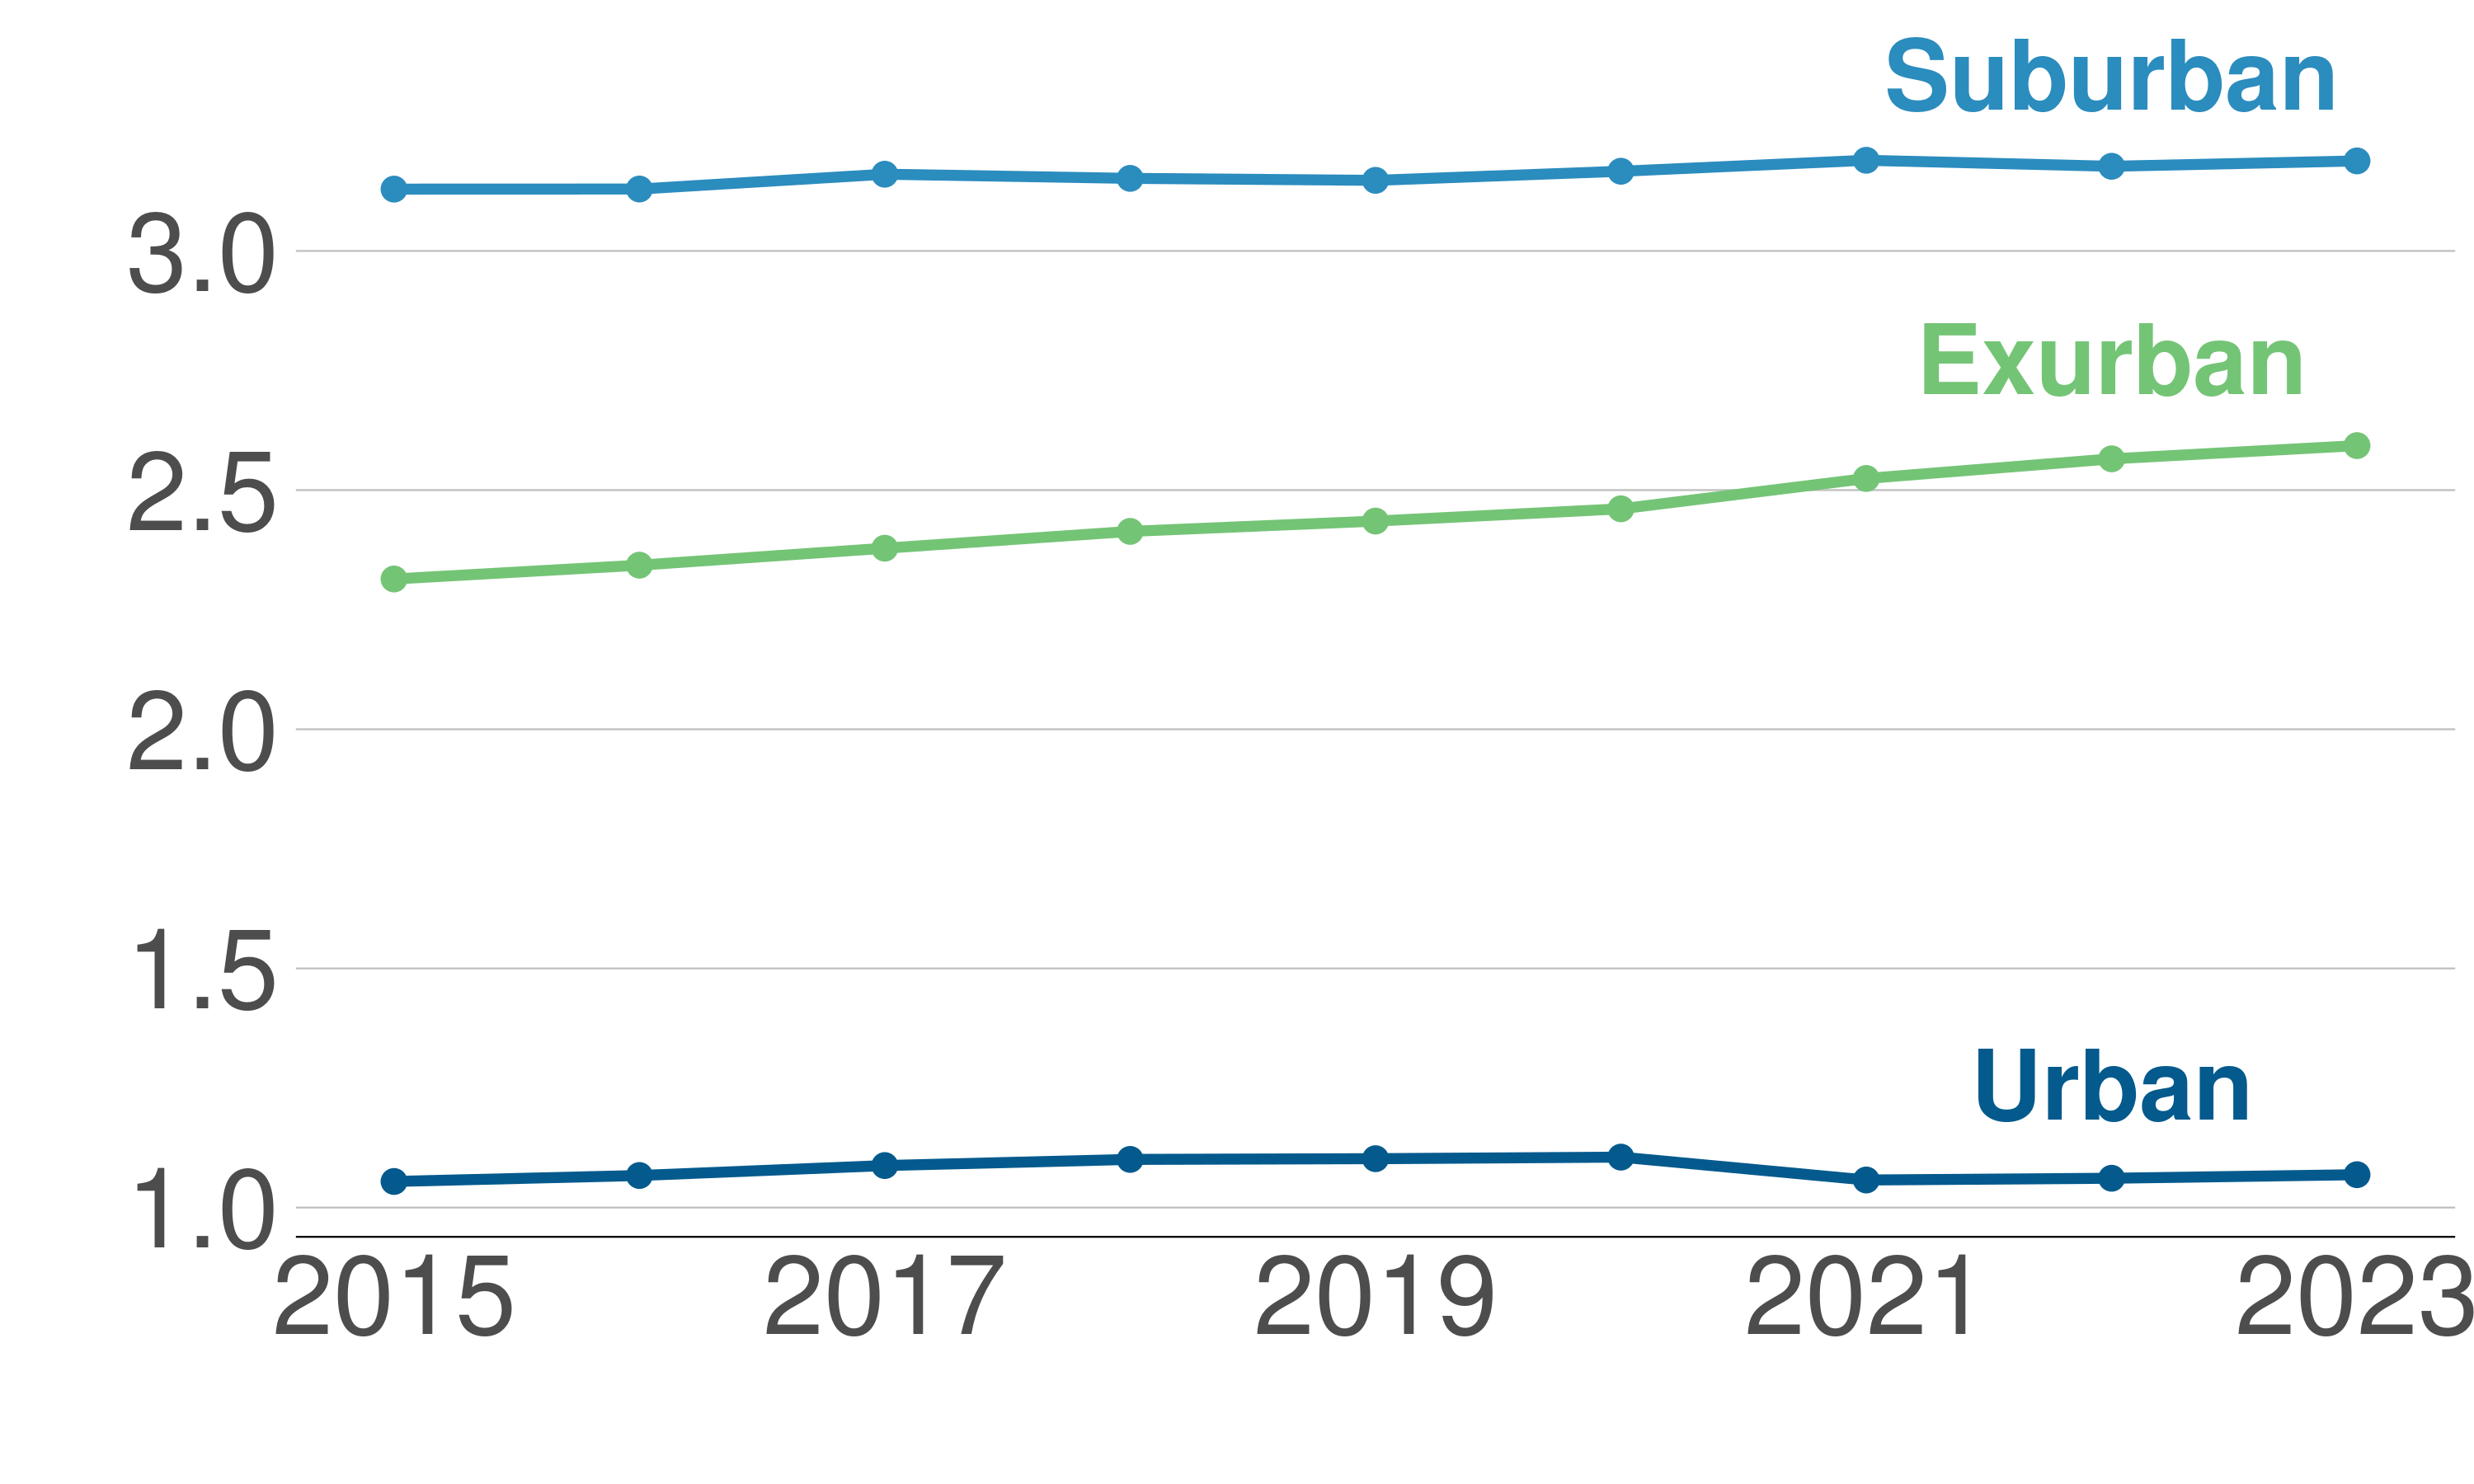
Population, normalized to 100 in 2015 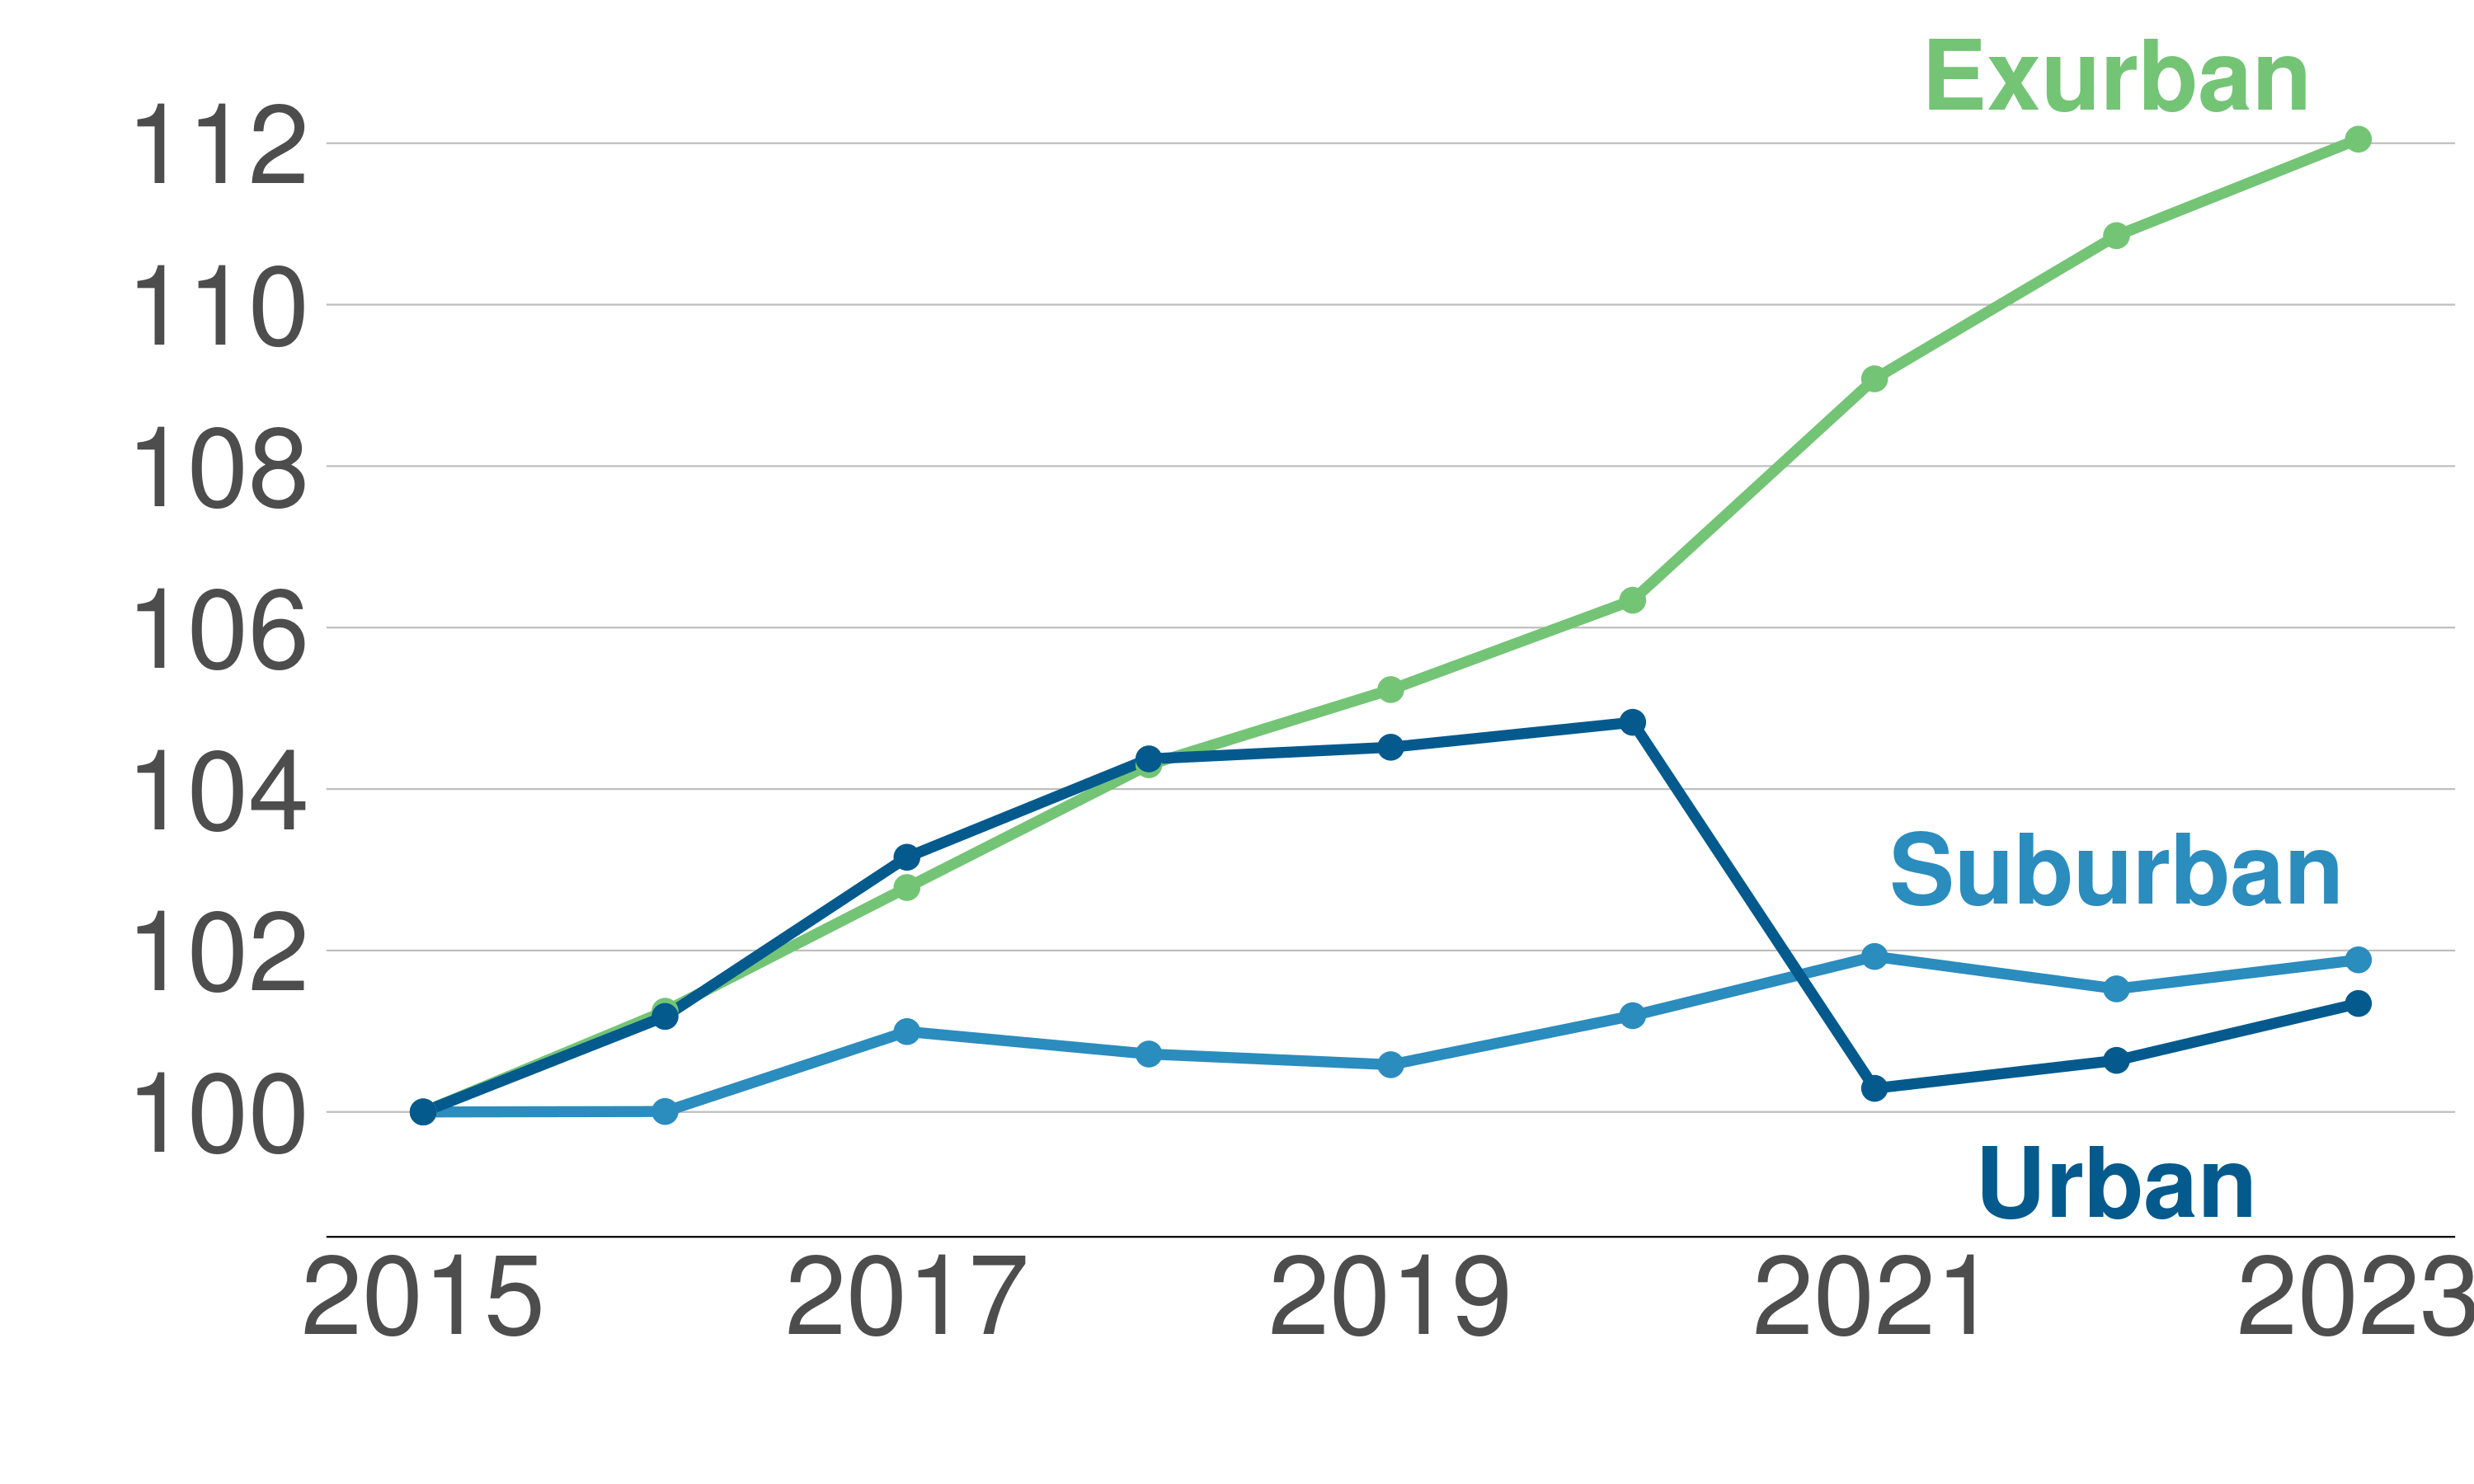
Notes and Sources: Census American Community Survey Public Use Microdata Sample (PUMS) years 2015-2023, 1-year Estimates. We use variable PWGTP. For 2020, we use American Community Survey 2020 experimental data.
A jurisdiction’s population comes from both the number of housing units and the number of people in each housing unit. Below, we look at how these two components change over time. Let us look at household size first, in Figure 2.2.
In the first panel, we see that average household size today is lower everywhere than it was before 2020. The second panel in Figure 2.2 shows changes in household size relative to 2015 by area type. The household size decrease is smallest in exurban jurisdictions. Households started out largest there, with about three members on average, and the gap with other jurisdictions has only grown since the onset of the pandemic. On the opposite side of the spectrum are households in urban jurisdictions. Urban households were generally meaningfully smaller already than in suburban and urban jurisdictions prior to the pandemic–below 2.5 members–and their size has sharply declined, to only slightly above two members on average. Both in terms of household size and the decline in household size, suburban jurisdictions find themselves in between urban and exurban district, but generally closer to exurban ones.
It is worth highlighting just how large the drop in average household size in urban jurisdictions has been, as the second panel illustrates. Between 2020 and 2023, the size of the average household in those places shrank by well over 10 percent, and is now almost 12 percent lower than it was in 2015. The average urban household has 2.06 persons per household, down from 2.34 in 2015. If the number of households had remained constant – and we will show below it did not – the total number of residents would have declined by over 10 percent.
Figure 2.2: Household Size Has Decreased Since the Pandemic, Especially in Urban Jurisdictions
Average household size 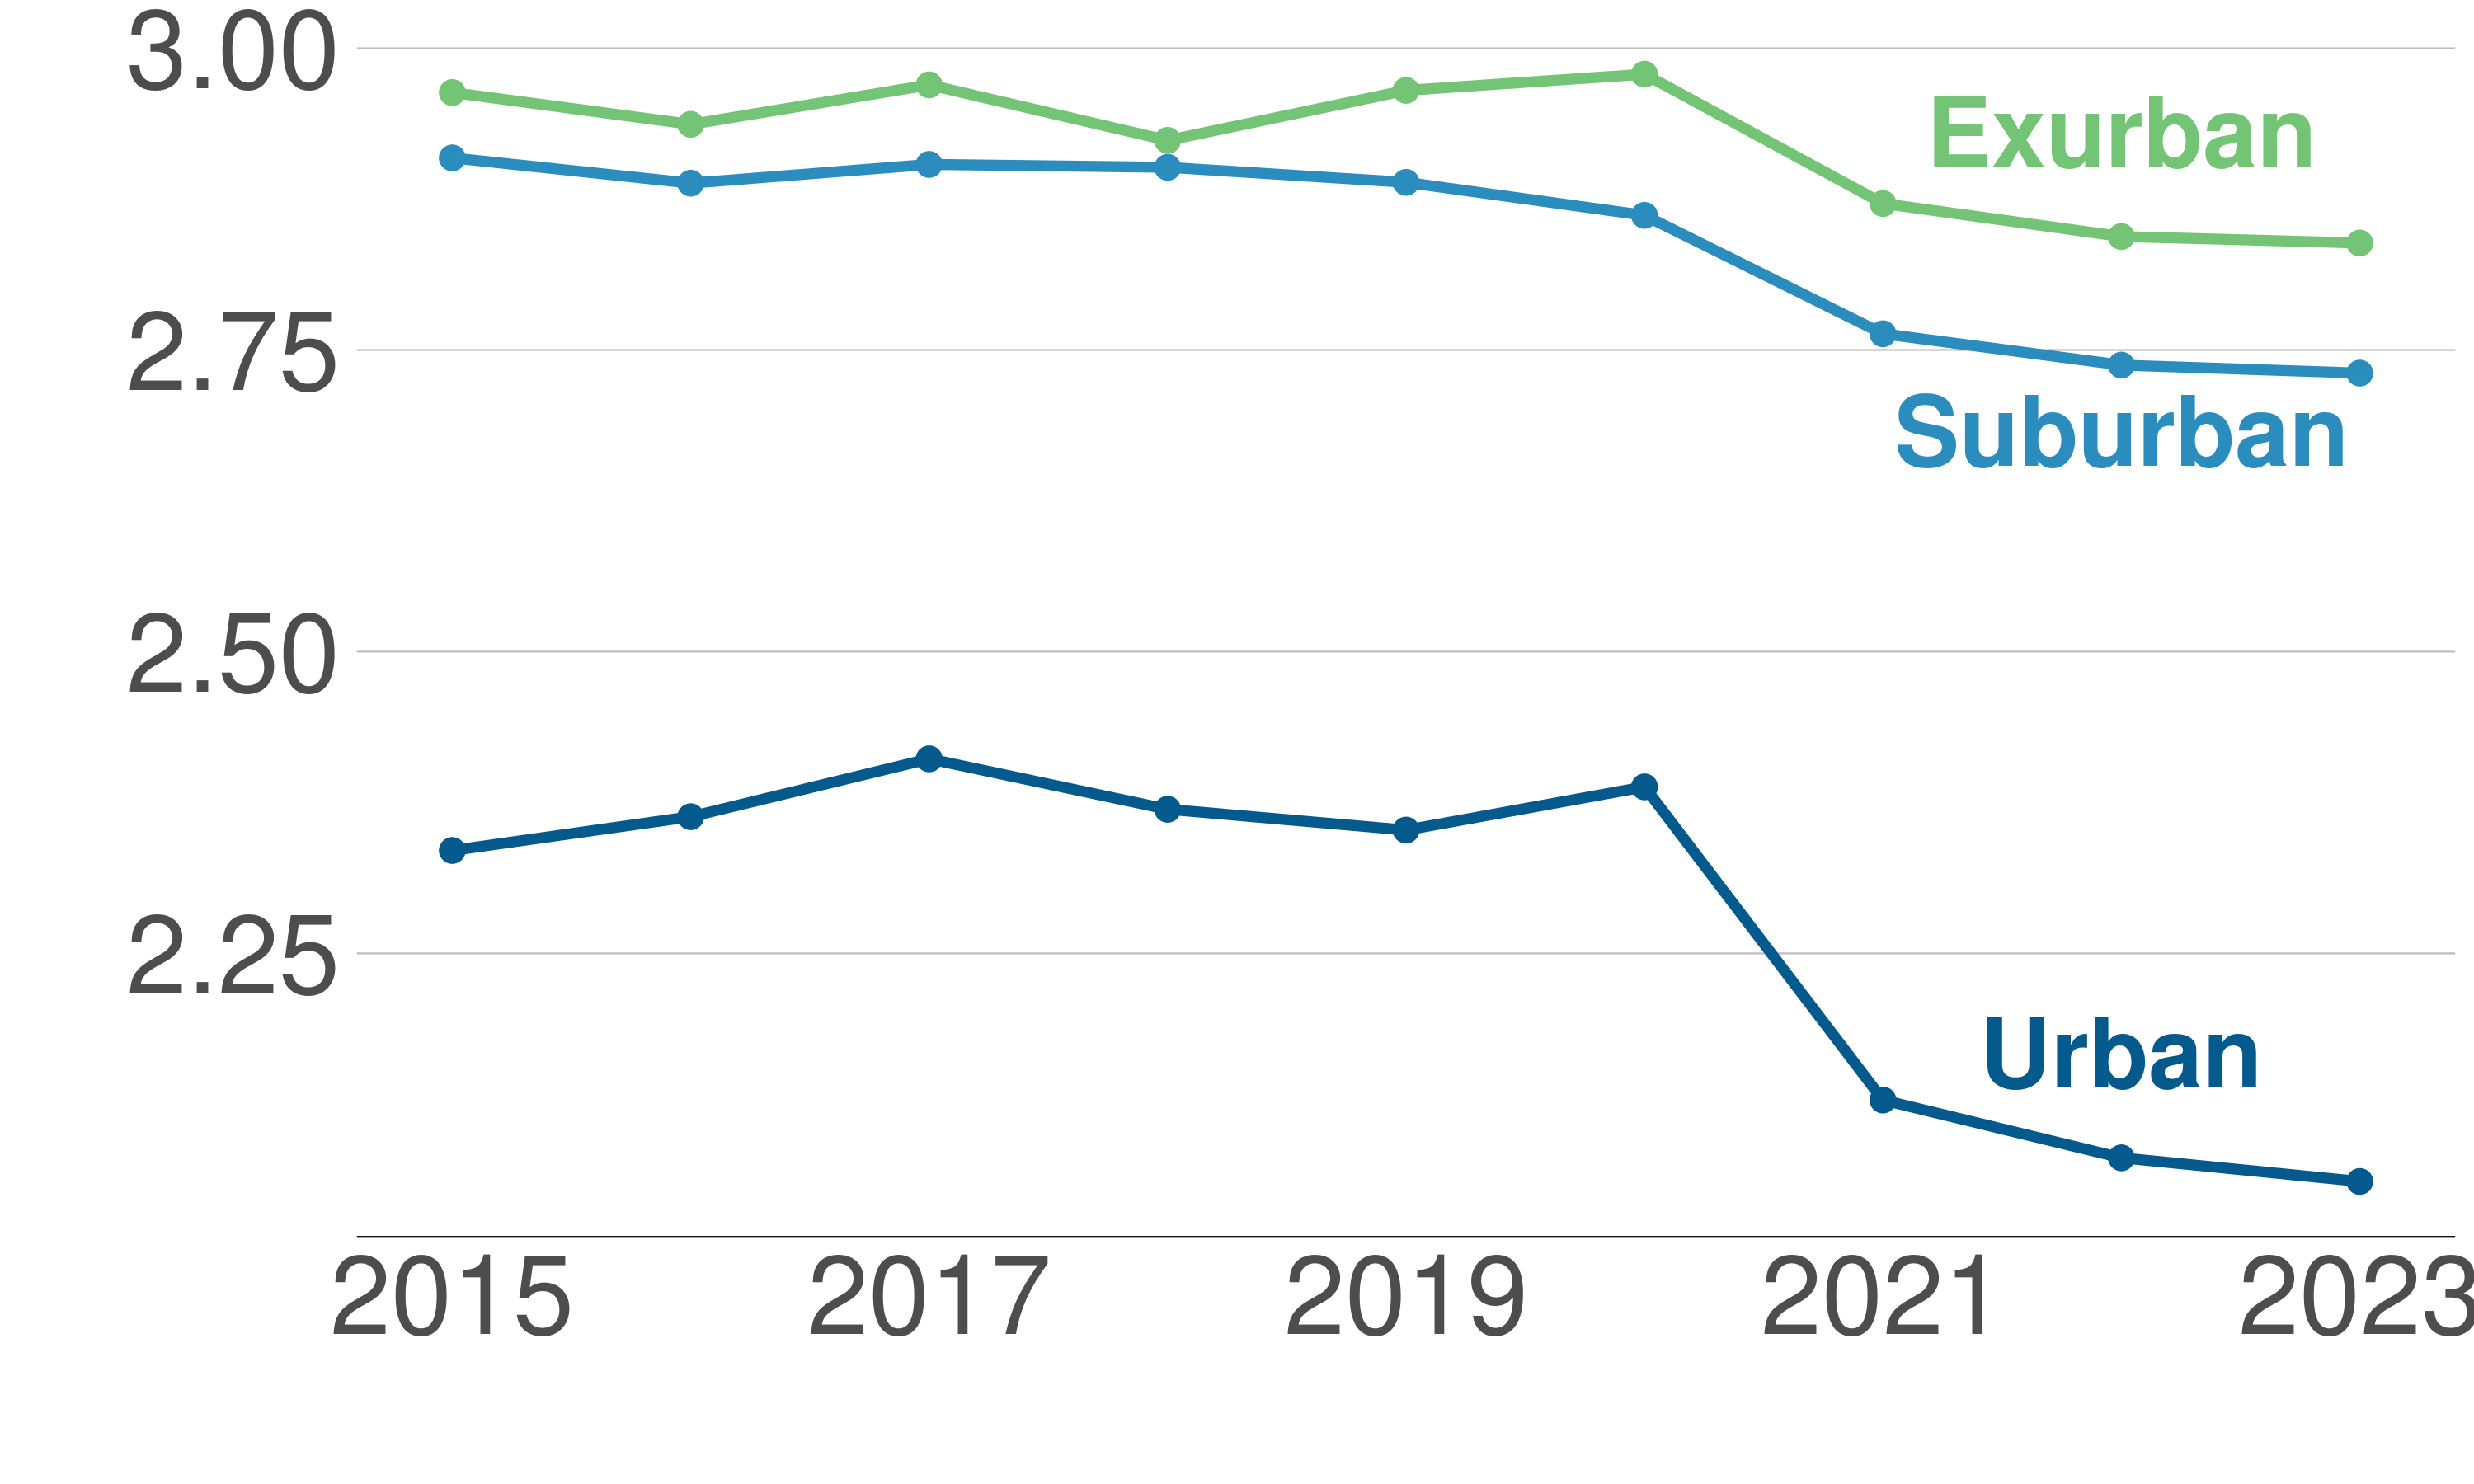
Household size, normalized to 100 in 2015 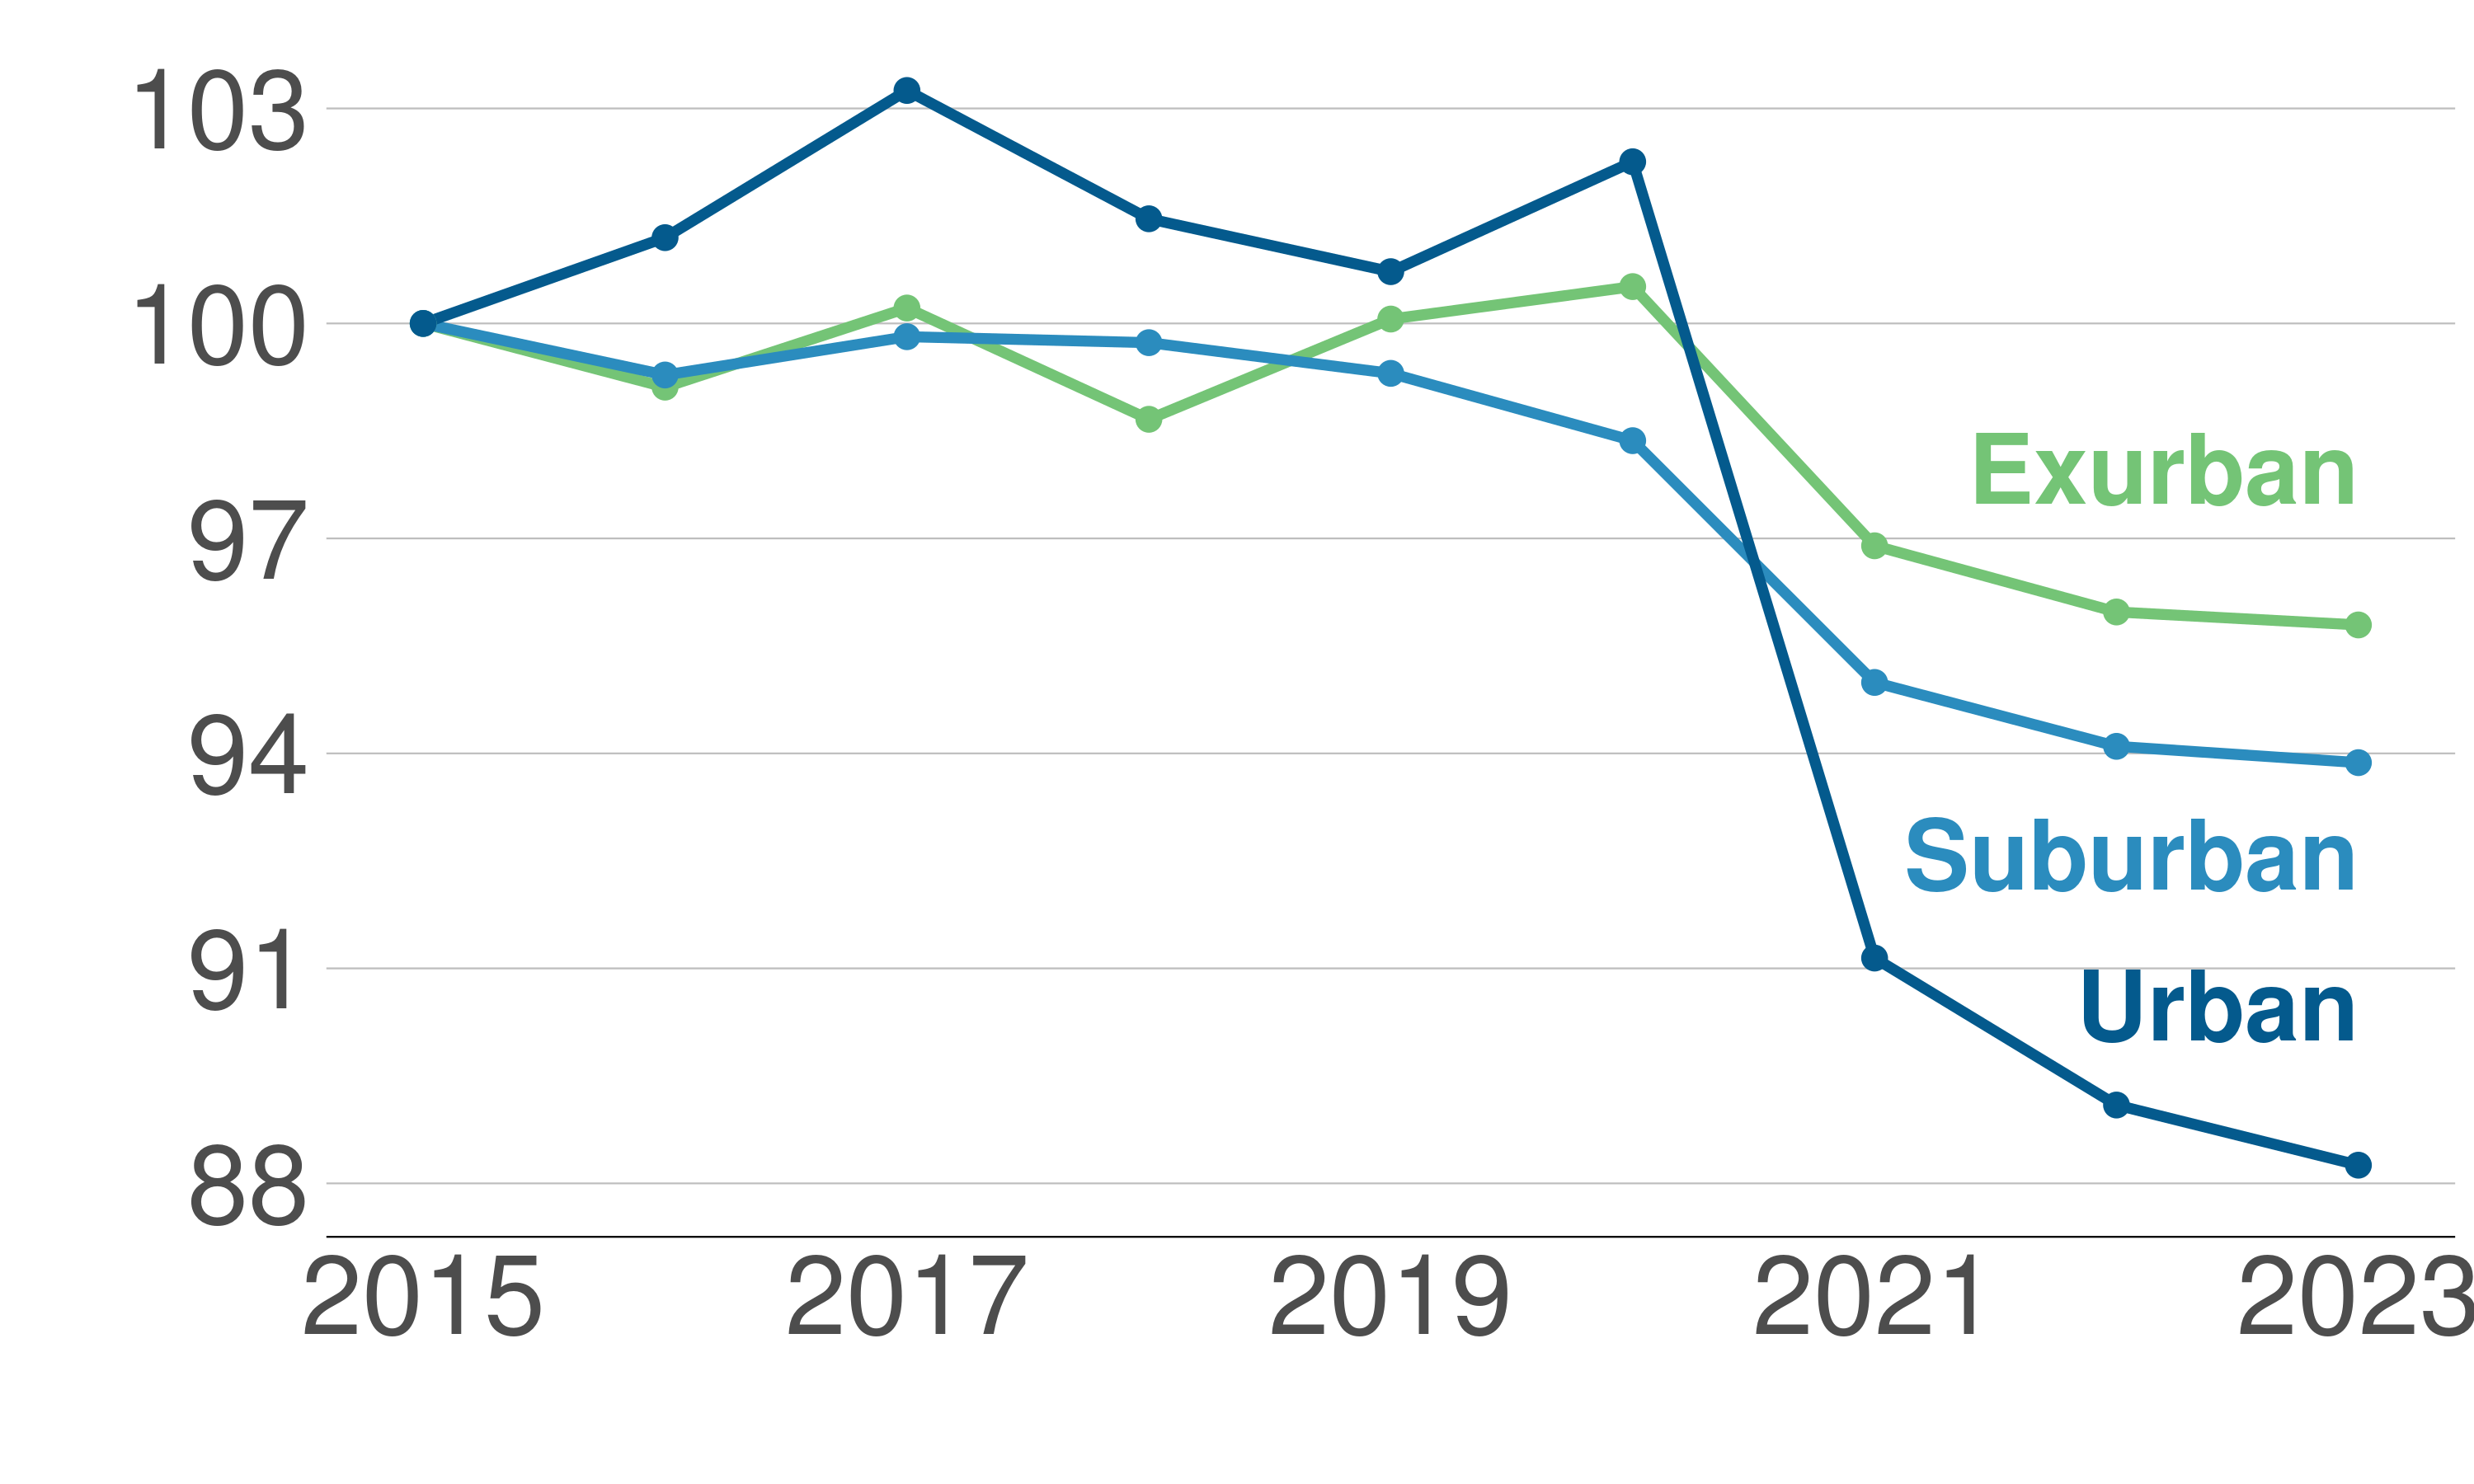
Notes & Sources: Census American Community Survey Public Use Microdata Sample (PUMS), 1-year Estimates for years 2015-2023. For 2020, we use American Community Survey 2020 experimental data. We use variables PWGTP for total population and WGTP for number of households to calculate people per household.
Rather than declining, however, the number of residents in urban jurisdictions has increased over this time period. As household size dropped rapidly, the number of households in these jurisdictions grew even faster, by close to 15 percent between 2015 and today. As Figure 2.3 shows, this growth rate was faster than in both suburban and exurban jurisdictions, where the number of households increased by 7 and 13 percent respectively.
Figure 2.3: The Number of Households Has Continued to Grow, Even and Especially in Urban Areas
Number of households in millions 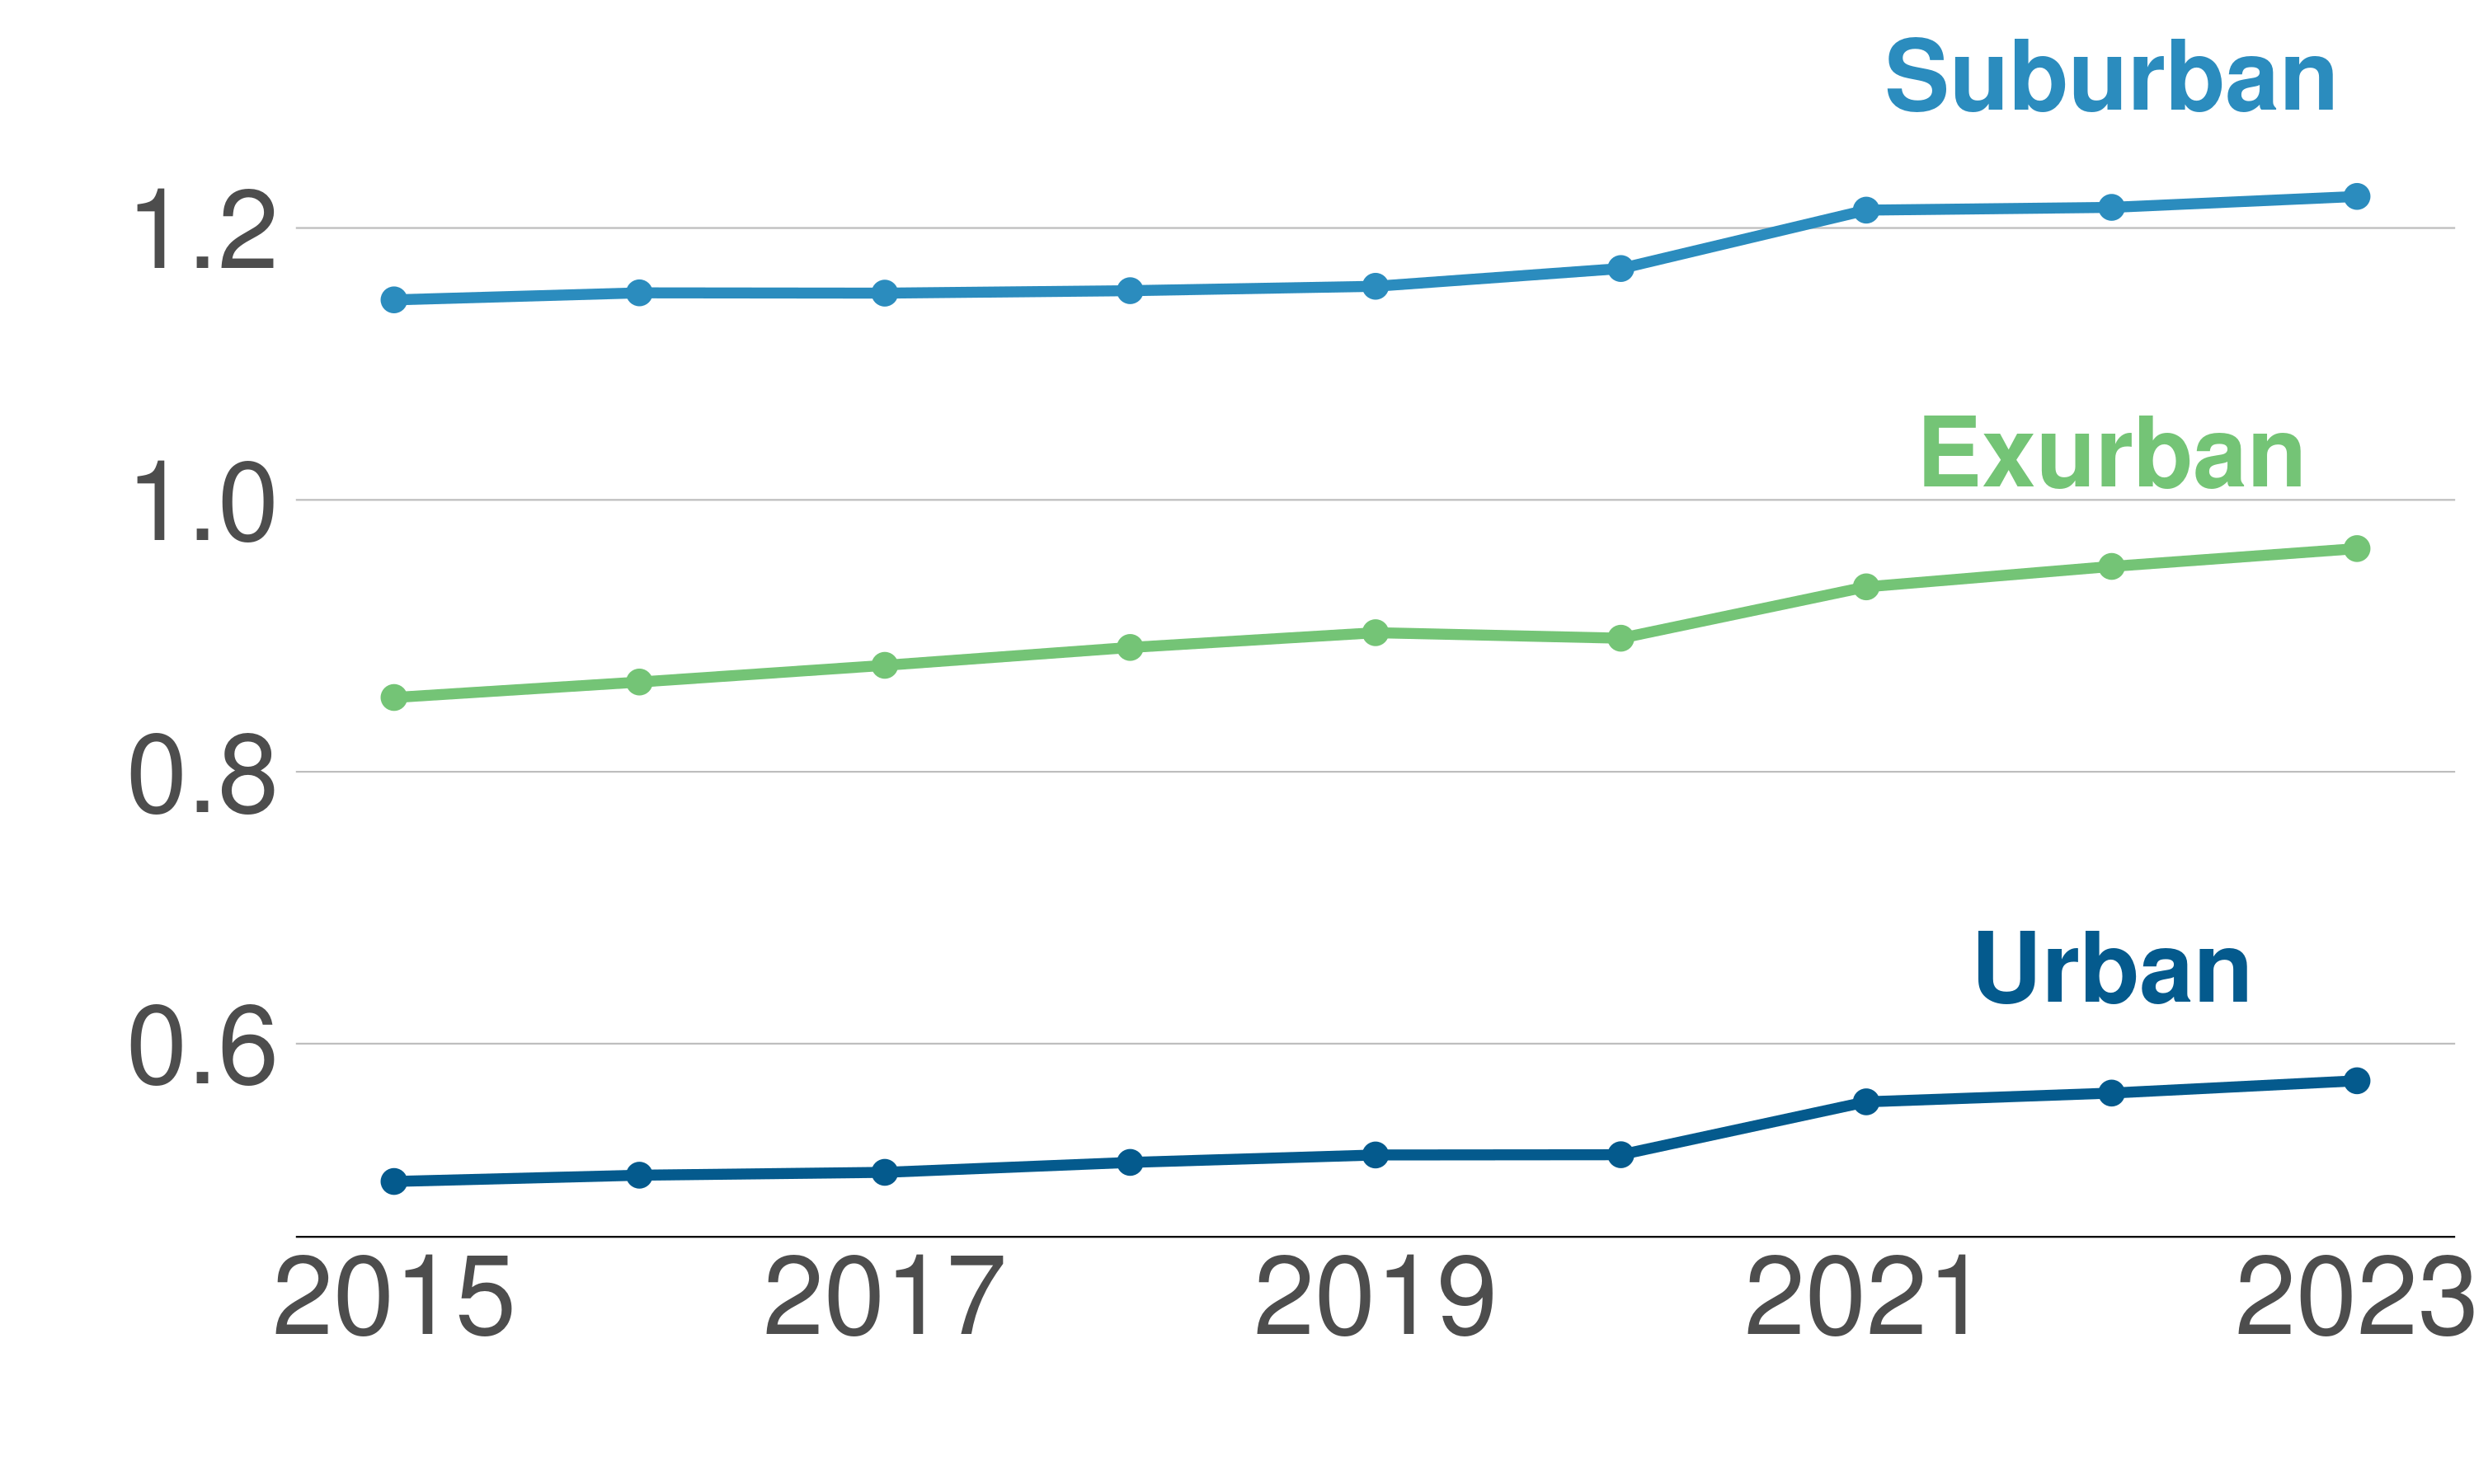
Number of households, normalized to 100 in 2015 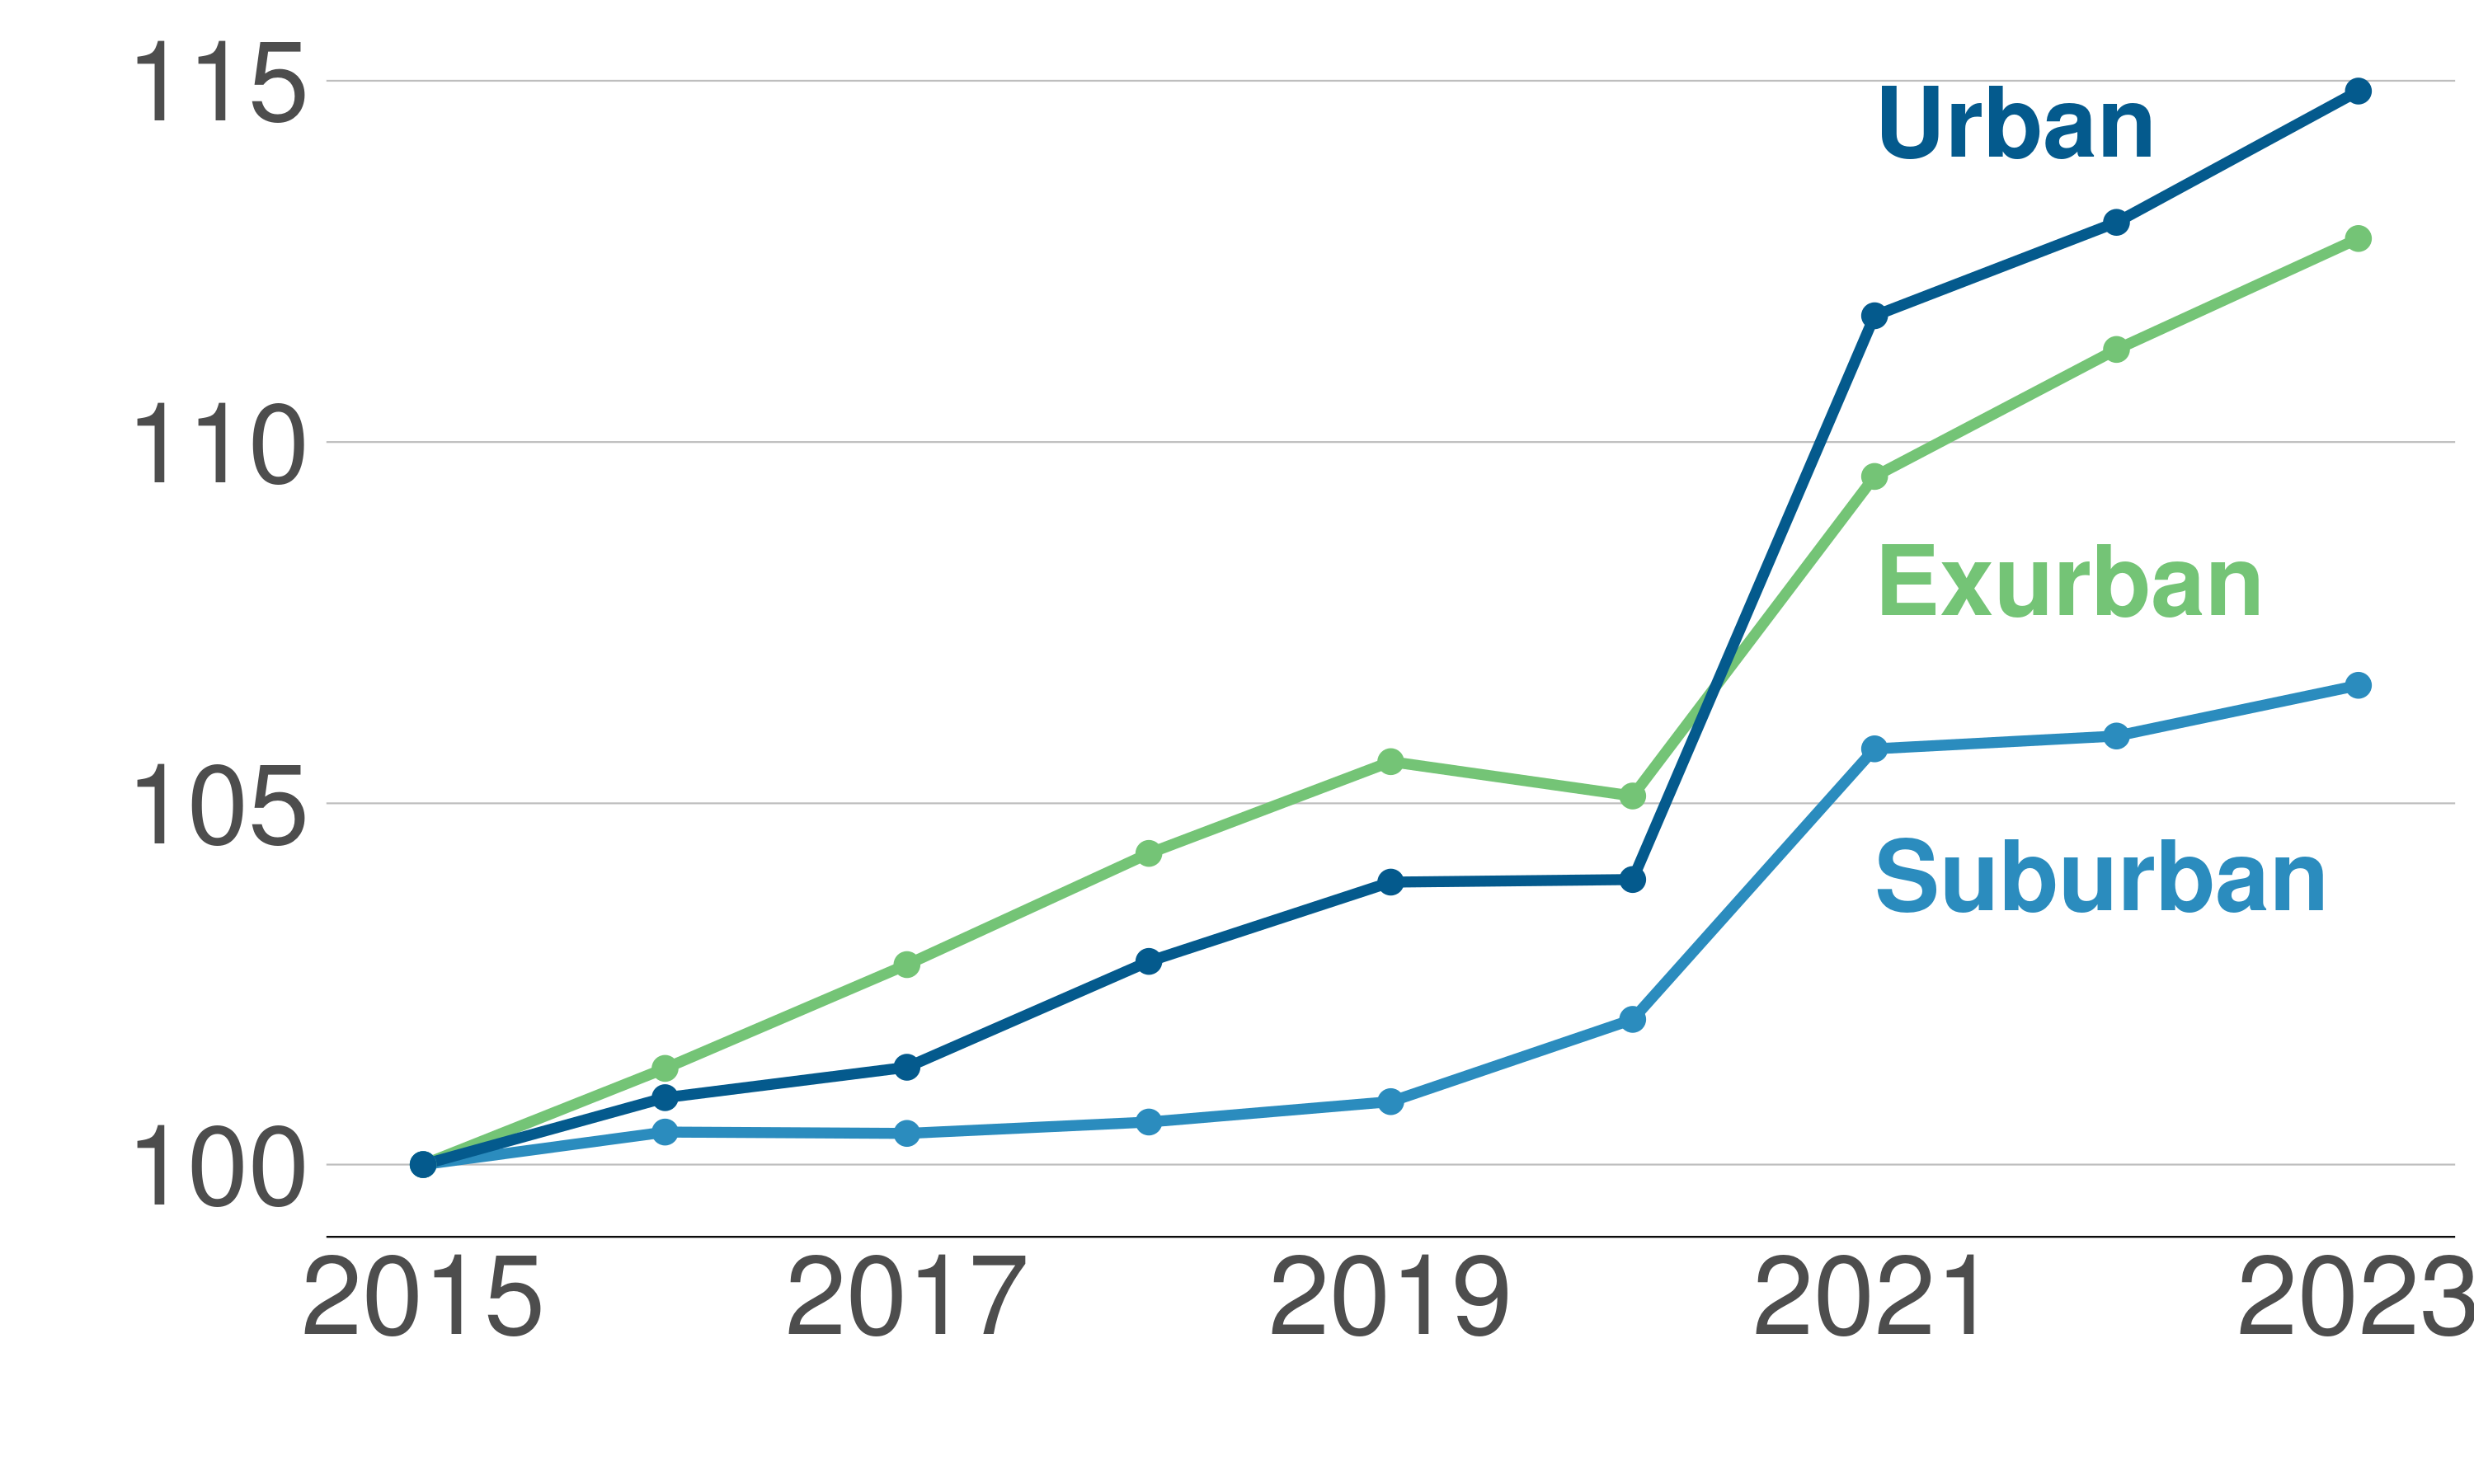
Notes & Sources: Census American Community Survey Public Use Microdata Sample (PUMS), 1-year Estimates for years 2015-2023. For 2020, we use American Community Survey 2020 experimental data. We use variable WGTP for number of households.
That said, suburban and exurban jurisdictions are home to a much larger absolute number of households. As a result, and despite the faster relative growth in urban households, suburban and especially exurban households grew more in absolute number than their urban counterparts. In 2023 there were over 100,000 more exurban households than in 2015, while urban and suburban areas both gained about 75,000 households from 2015.