Chapter 1: Residential and Commercial Real Estate Prices in Urban Jurisdictions Have Declined Relative to Suburban and Exurban Areas
Over the past decade, Capital Region real estate values have undergone significant localized shifts, influenced primarily by the COVID-19 pandemic and the rise of remote work. These trends have reshaped both residential and commercial real estate, altering rental price dynamics and commercial property values across urban, suburban, and exurban jurisdictions.
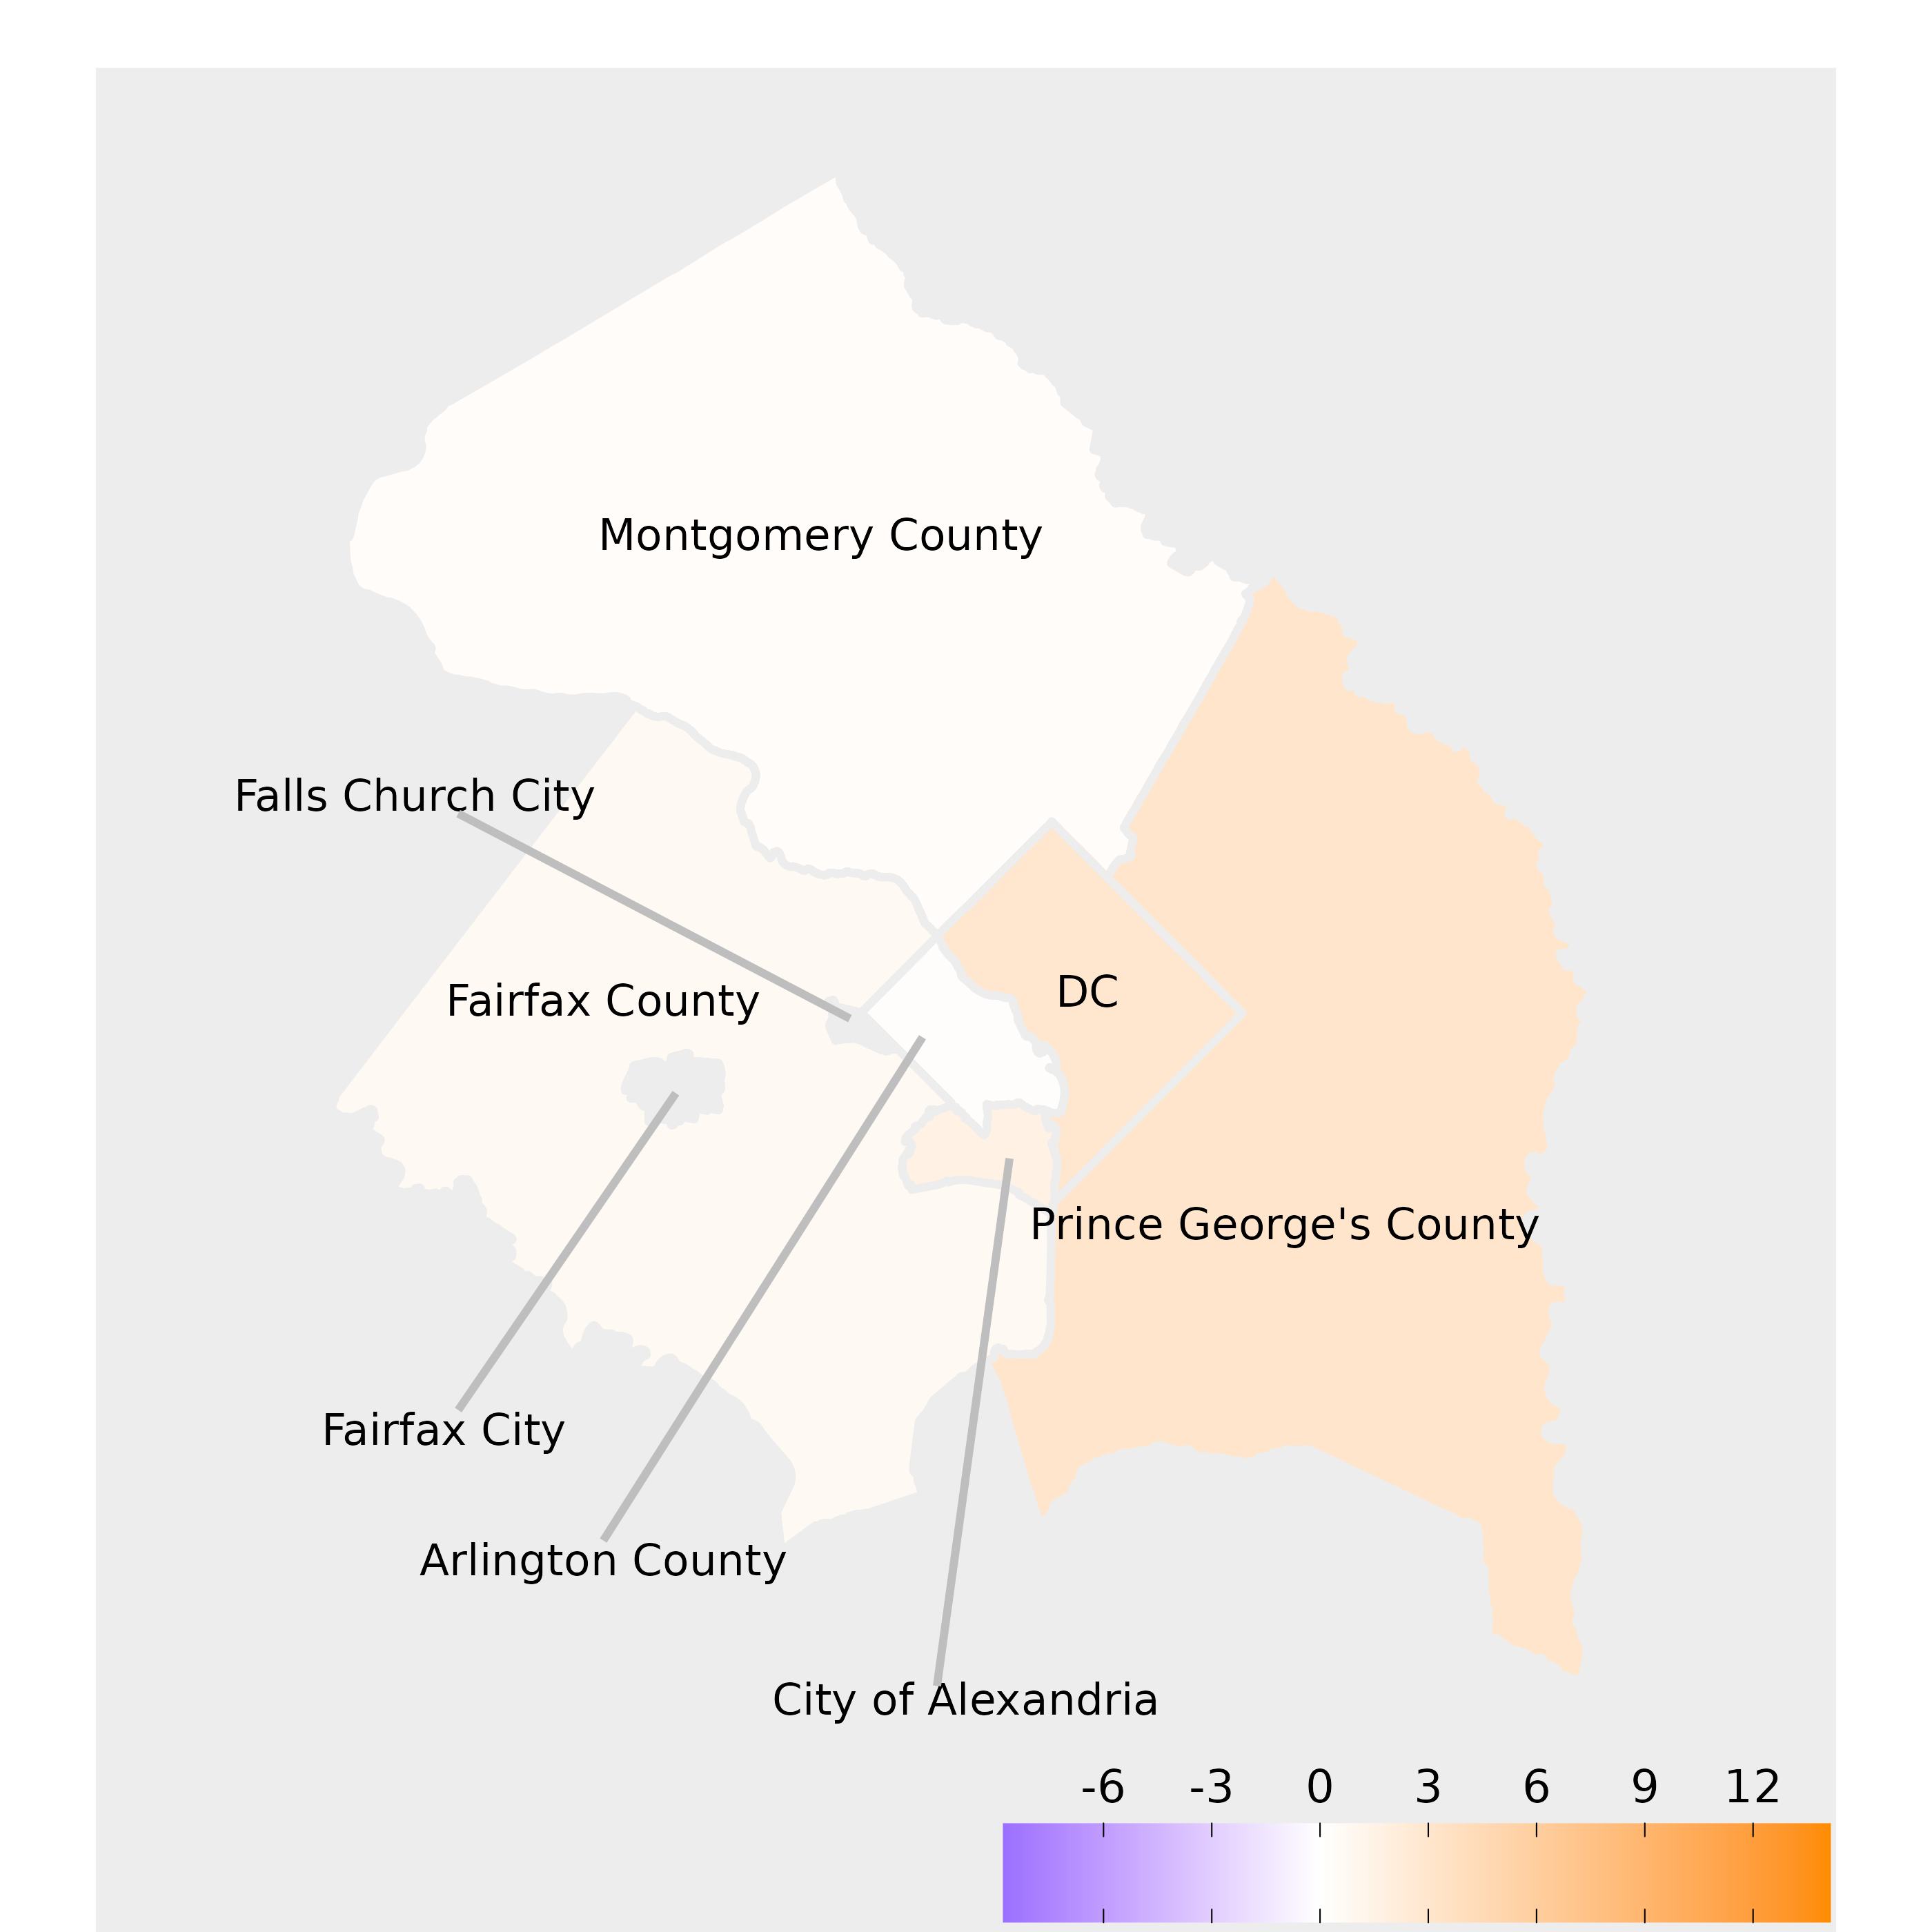
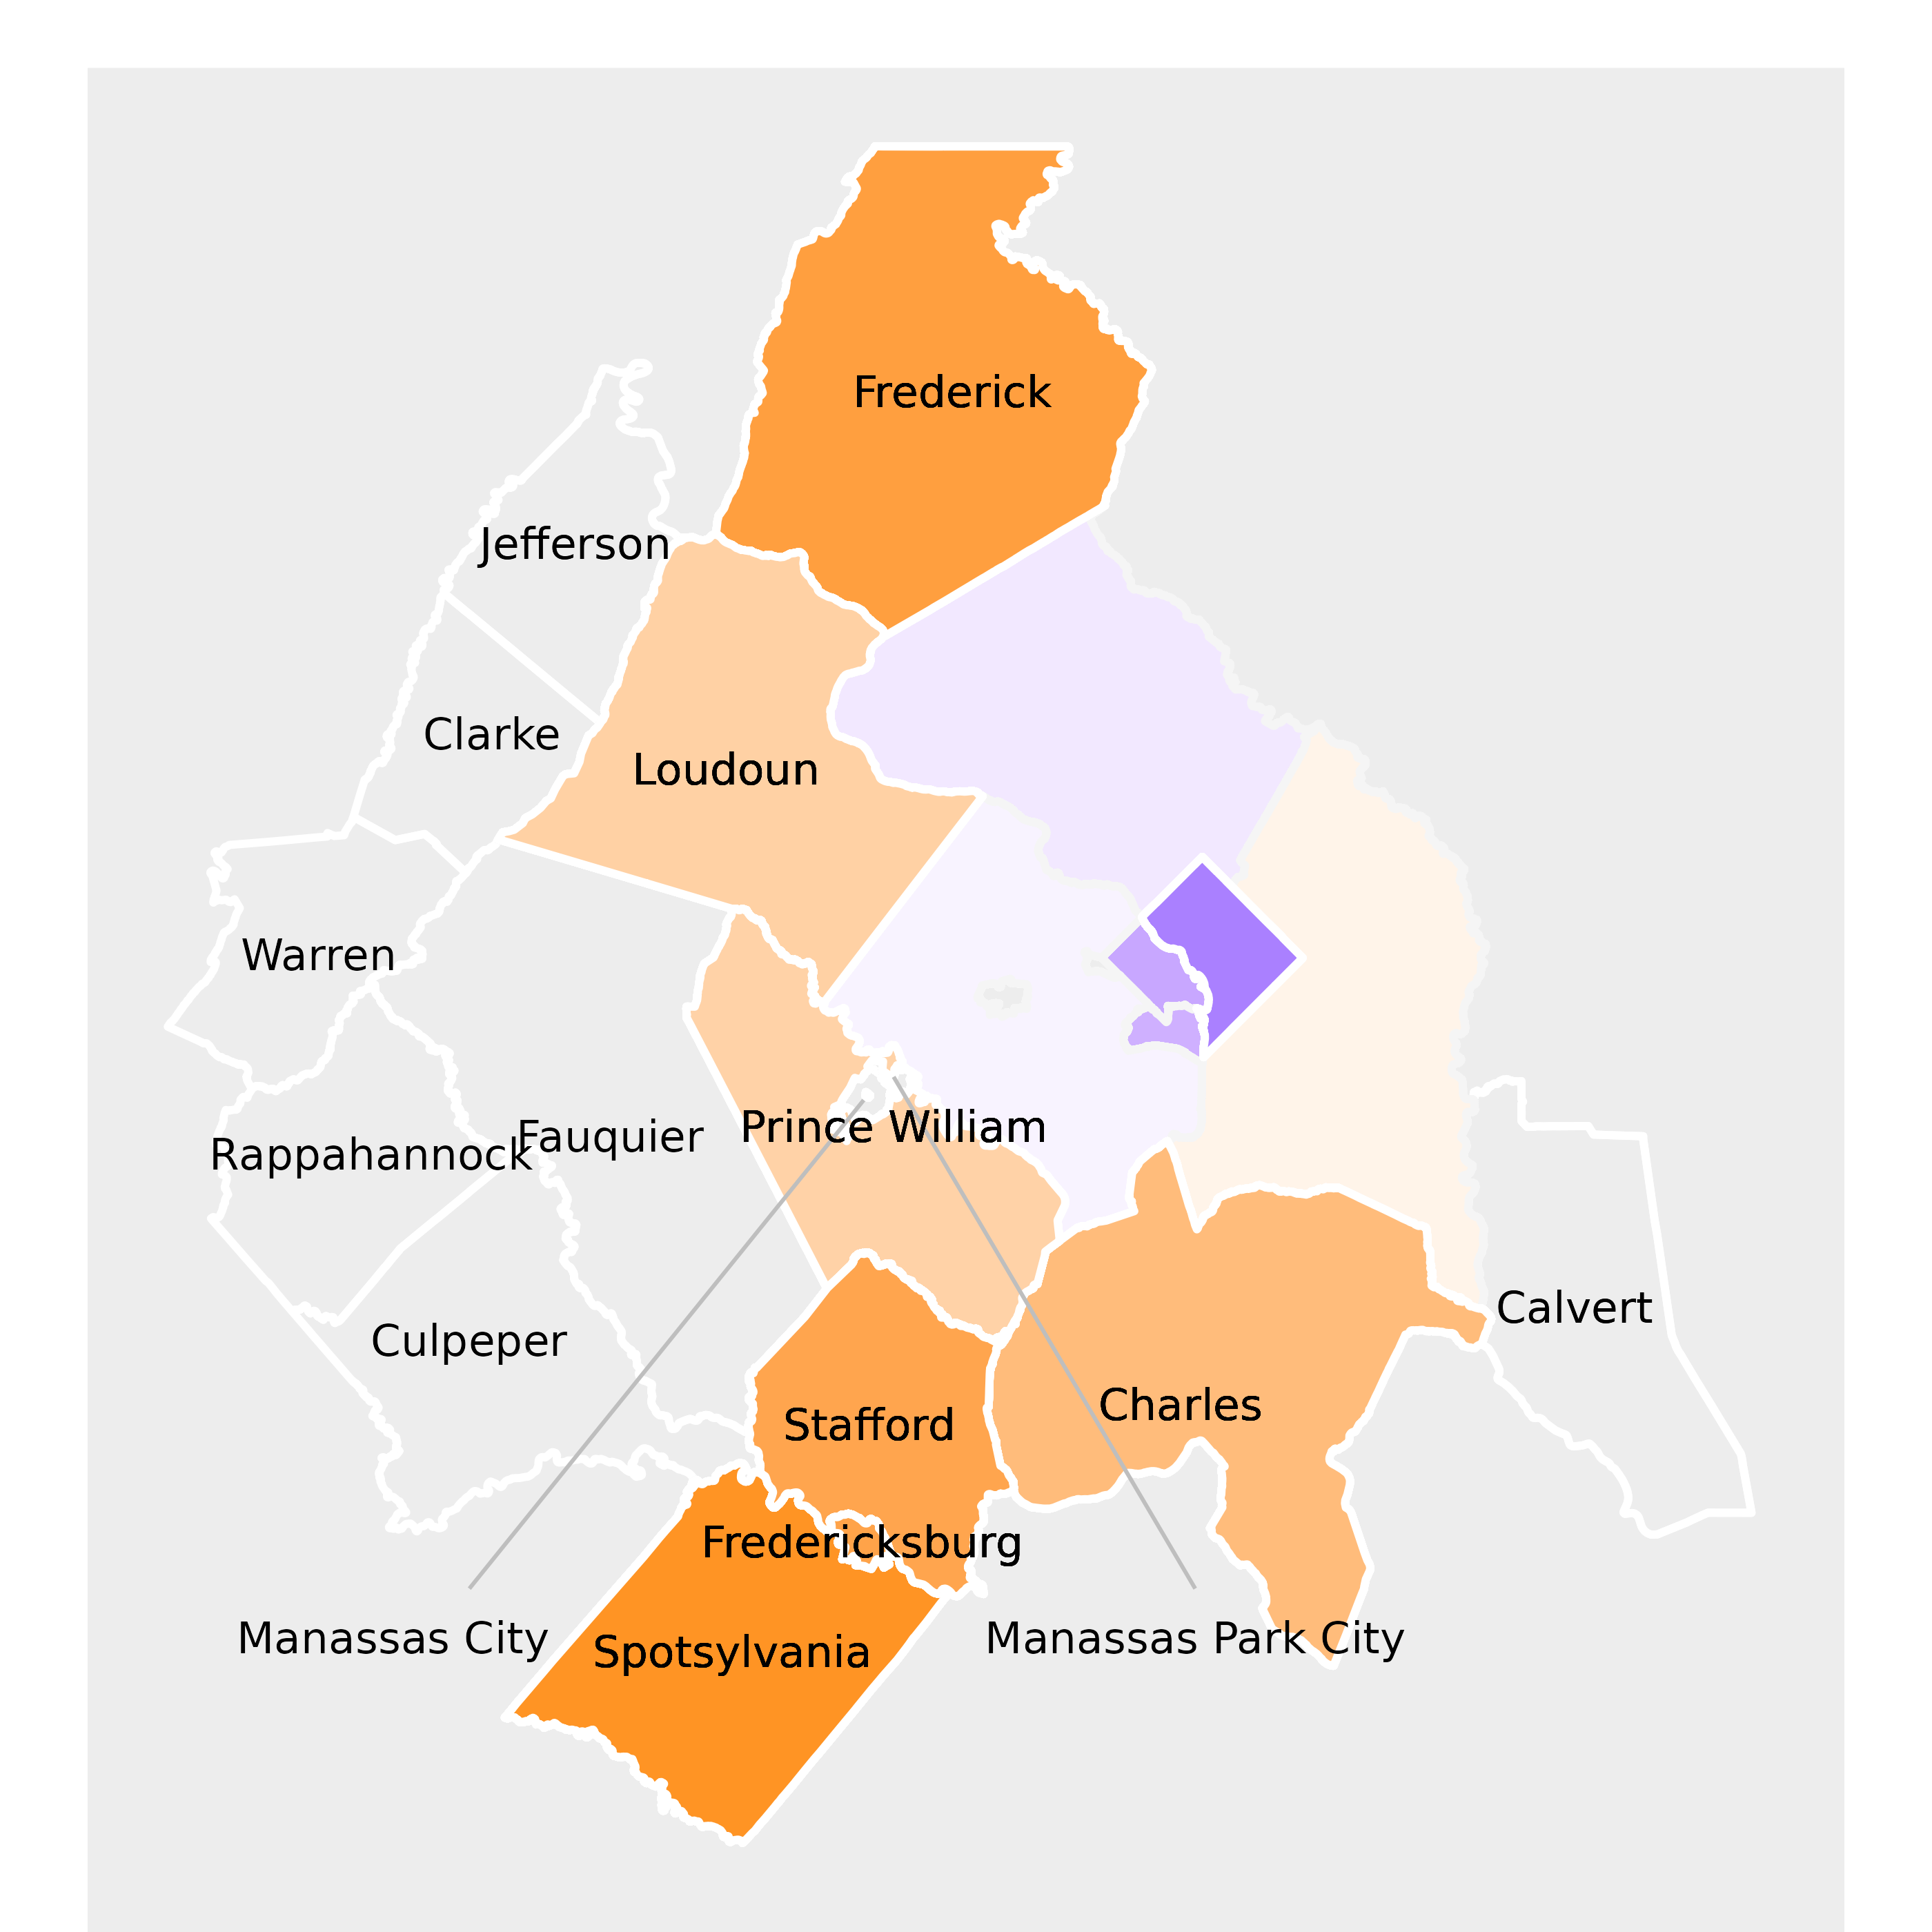
Figure 1.1: Urban and Suburban Areas Saw Large COVID Price Declines
Percent change in residential rent for urban and suburban jurisdictions, in 2023 dollars
a) 2015–2019
b) 2019-2023
c) 2023–2024
Notes: We show percent change in residential rent percent change (a) from 2015 to 2019, (b) 2019 to 2024, and (c) between 2023 and 2024. We remove Manassas City, Falls Church City, Manassas Park City, and Fairfax City, as these jurisdictions have no data before 2019.
Sources: Zillow Observed Rent Index, by county (or Virginia independent city) by year.
From 2015 to 2019 (Figure 1a), rental growth was strong in urban jurisdictions, with the District experiencing higher rent increases compared to surrounding counties. For instance, rents in the District grew by just over 3 percent during this period, significantly outpacing its neighboring counties of Fairfax and Montgomery. This greater urban growth likely reflected the increasing demand for city living and the limited housing supply in the urban core.
From 2019 to 2023 period (Figure 1b), with the arrival of the pandemic in 2020, previous patterns reversed sharply. Rents in urban jurisdictions fell, and the decline was greater than in suburban jurisdictions. For example, residential rent in the District declined by about 8 percent, while the suburban and exurban jurisdictions of Stafford and Spotsylvania counties, and the city of Fredericksburg saw double-digit rent increases. Remote work, business closures, and out-migration from the urban core likely contributed to the urban decline. While urban areas were hardest hit, local residents sought more space and affordability outside the central core, causing suburban rental markets to remain more stable or even see increased demand.
The most recent data from 2023 to 2024 (Figure 1c) presents a more optimistic outlook for urban jurisdictions in the Capital Region. Rent growth in the District has started to align more closely with the pace of suburban growth, signaling a potential recovery in demand for urban housing.
Figure 1.2: Exurban Areas Saw Large COVID Rent Increases, Moderating After 2023
Percent change in residential rent for Capital Region jurisdictions, in 2023 dollars
a) 2015–2019
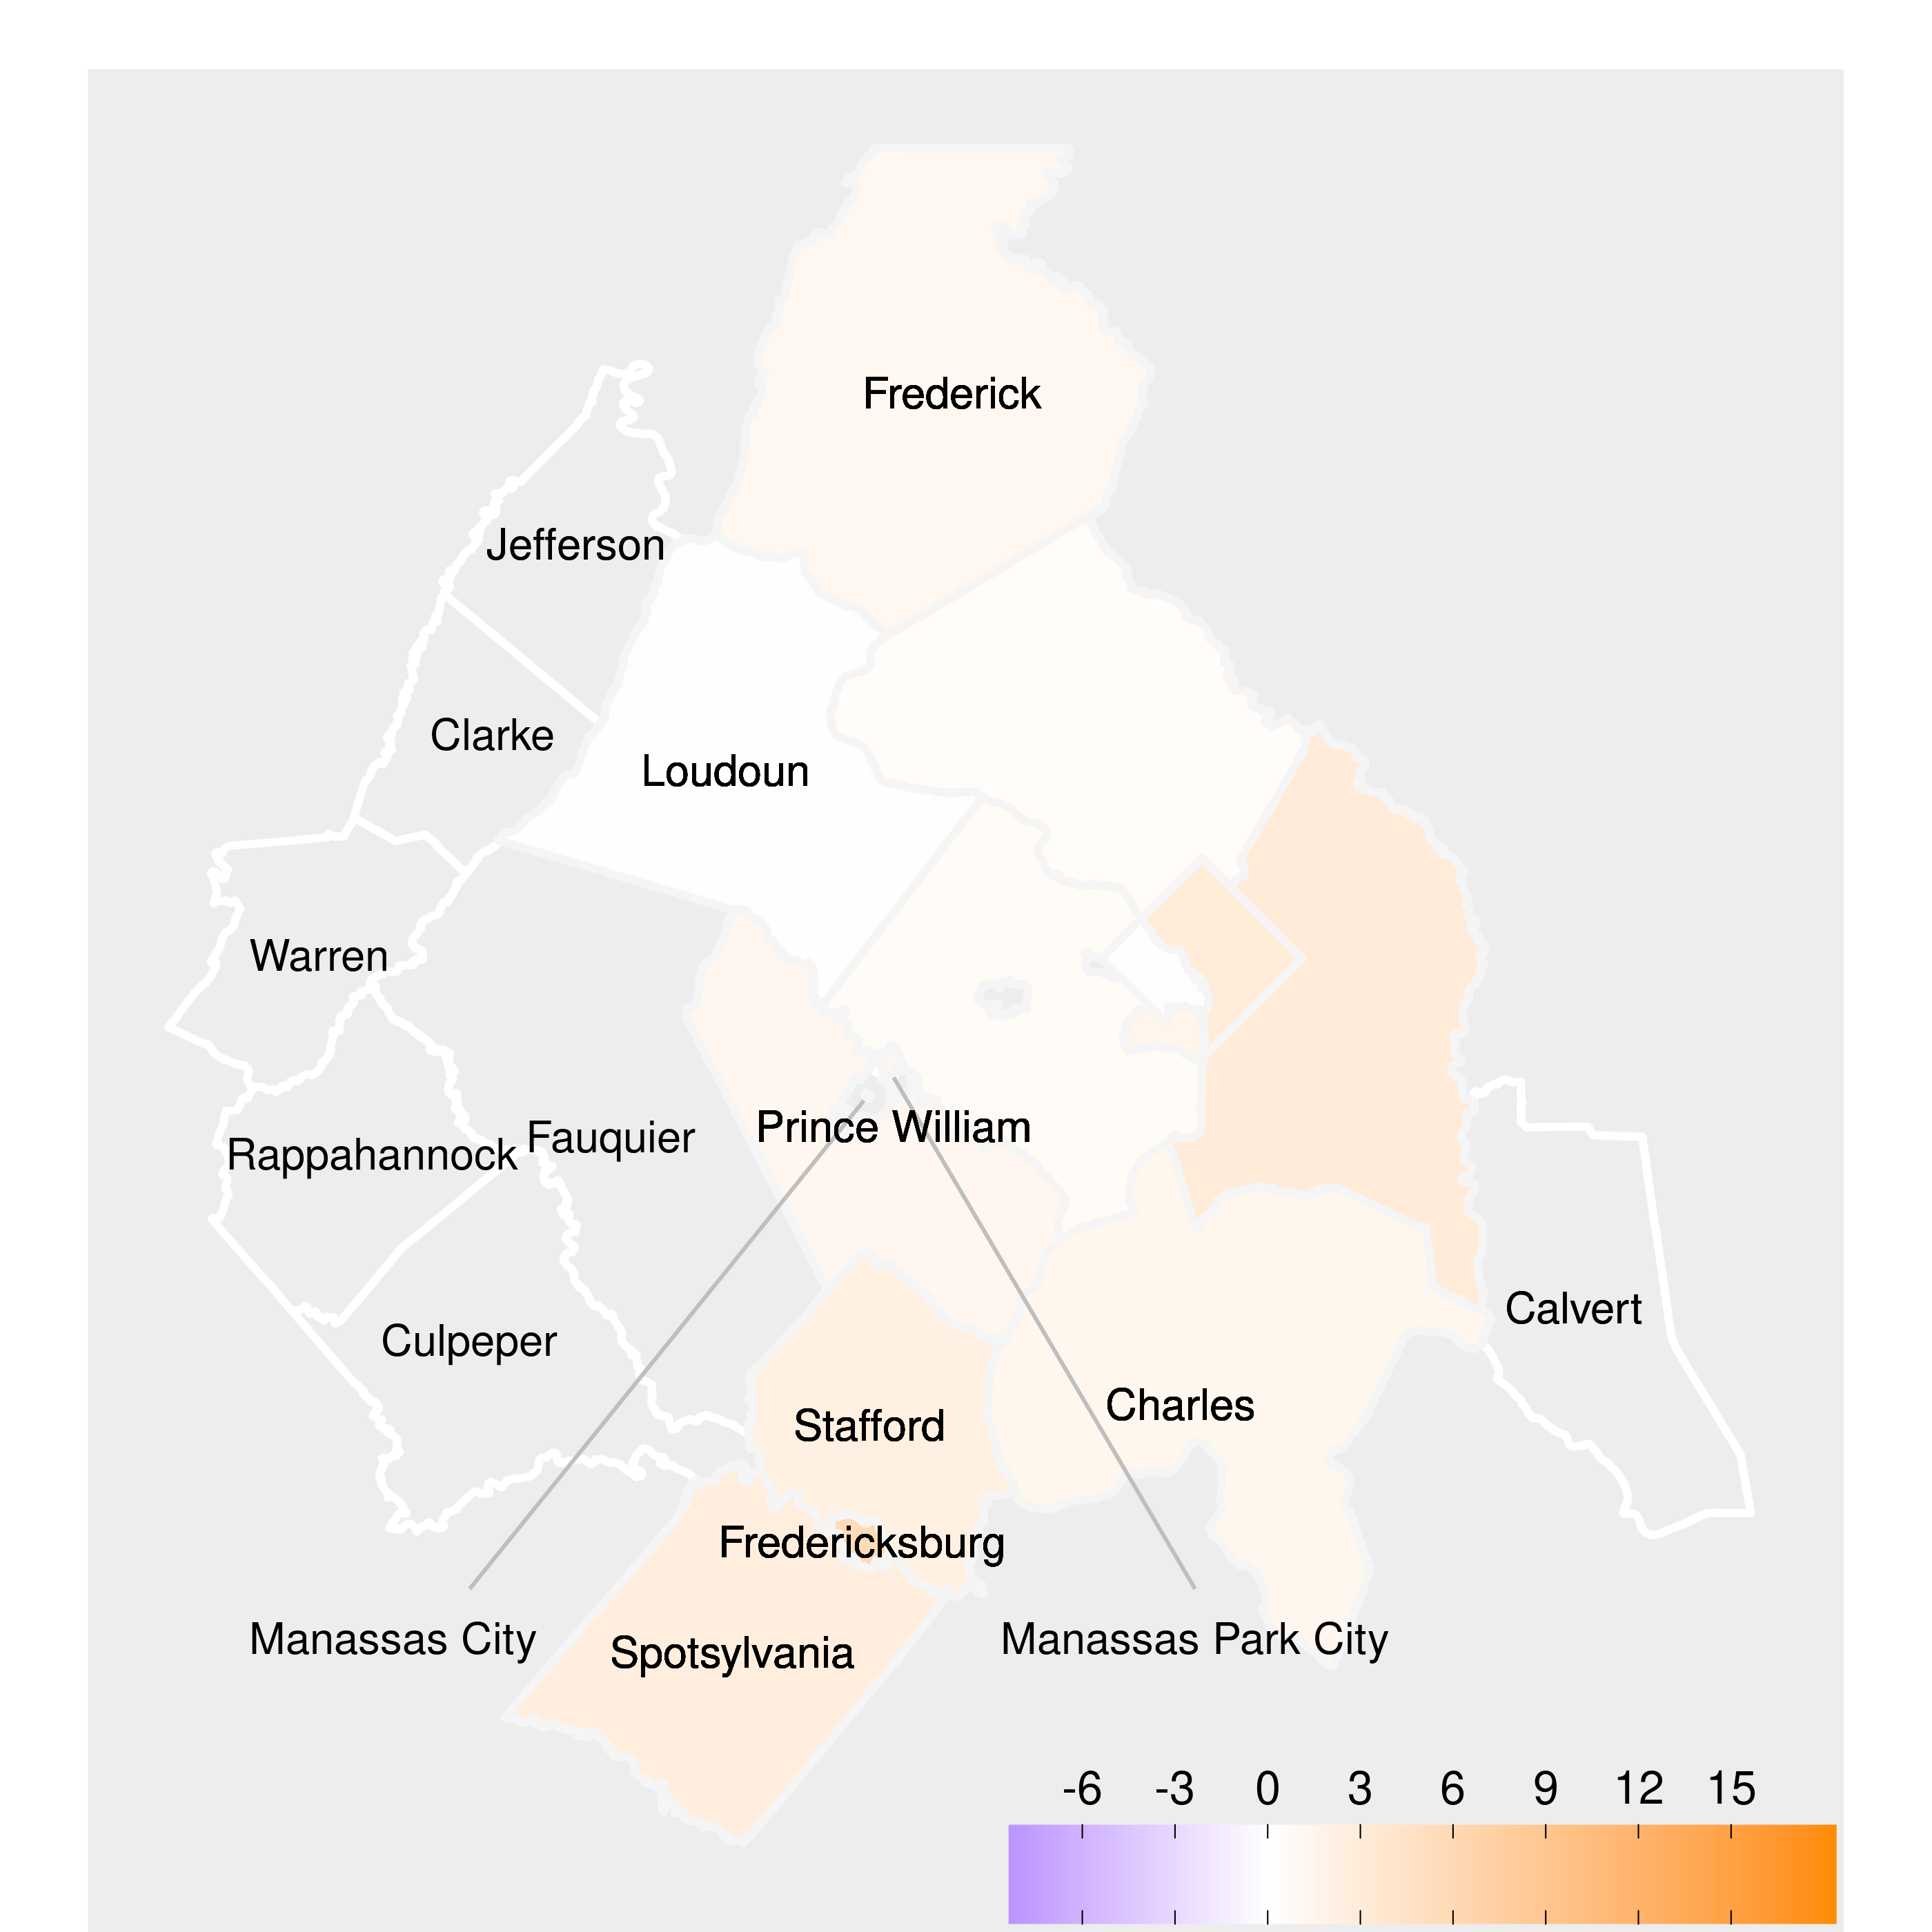
b) 2019–2023
c) 2023–2024
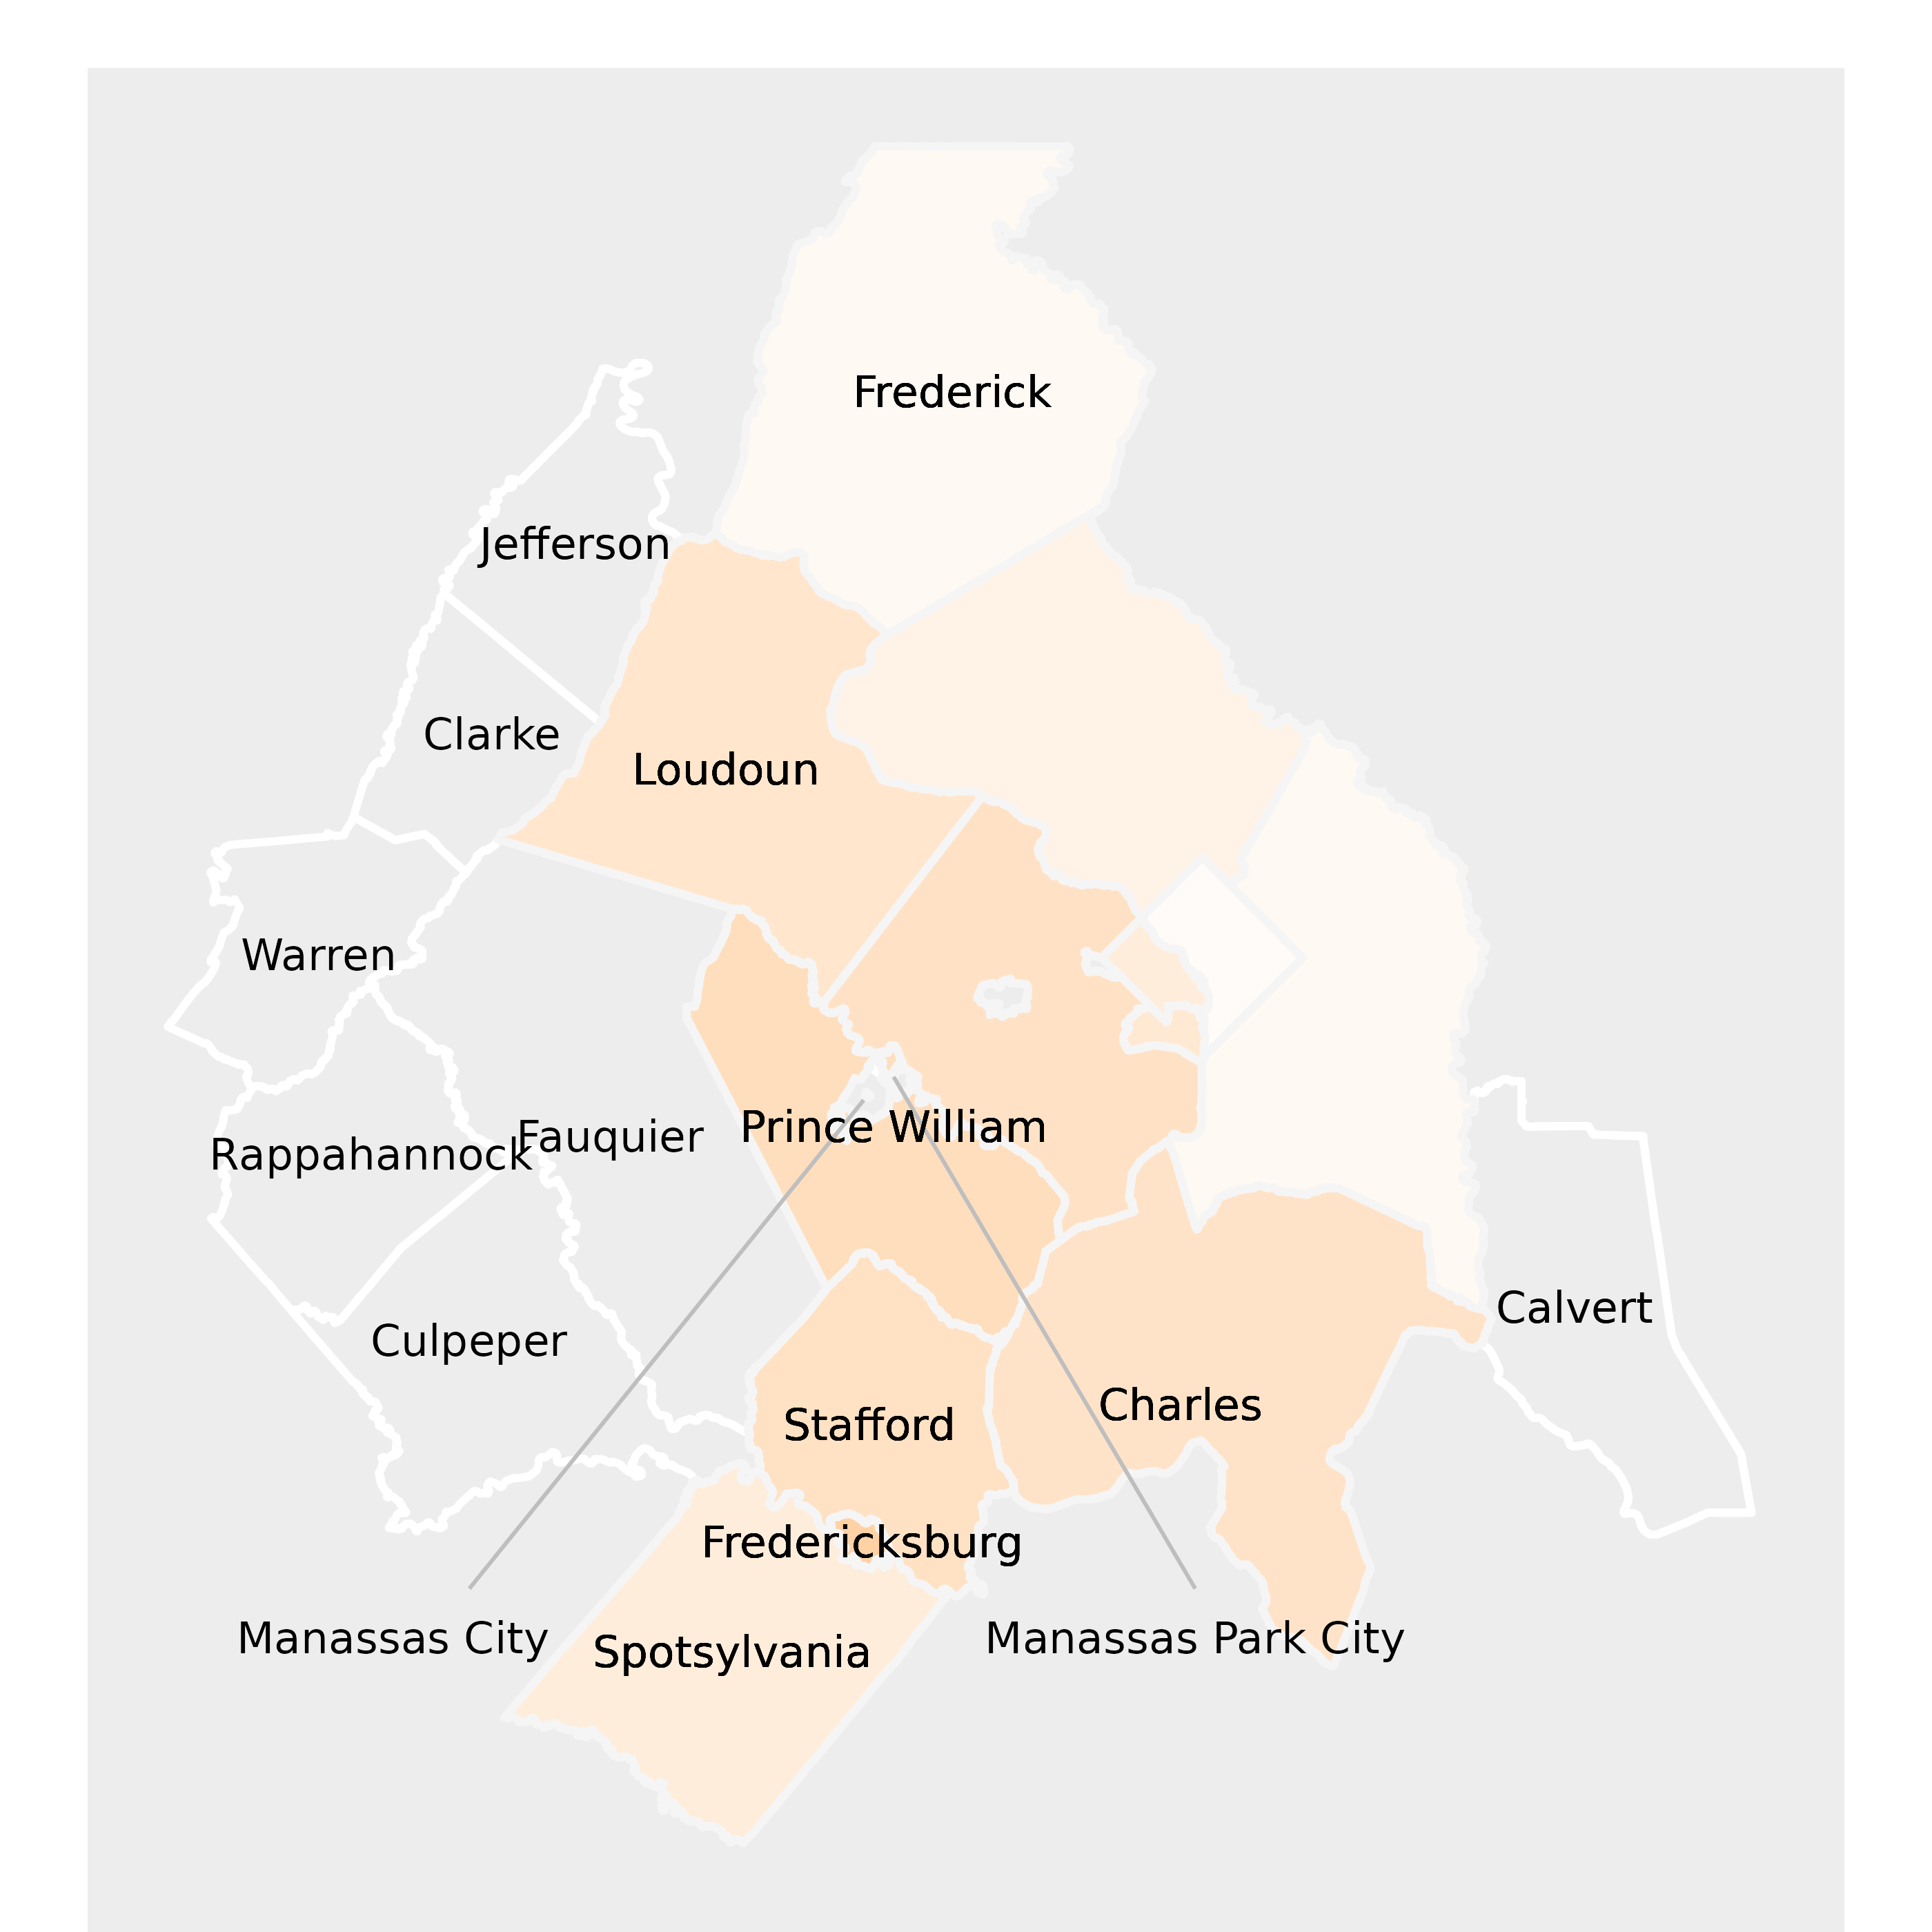
Notes: We show percent change in residential rent percent change (a) from 2015 to 2019, (b) 2019 to 2024, and (c) between 2023 and 2024. We remove Manassas City, Falls Church City, Manassas Park City, and Fairfax City, as these jurisdictions have no data before 2019.
Sources: Zillow Observed Rent Index, by county (or Virginia independent city) by year.
The pattern in exurban jurisdictions is quite distinct, as Figure 1.2 shows. For the exurban jurisdictions where we observe price changes (we do not have data for many smaller jurisdictions), rent increases are modest before the pandemic and are the very largest in the Capital Region from 2019 to 2023. During this five year period, rents grew by 12 percent in Frederick County, Maryland, and by 13 percent in Spotsylvania County, Virginia.
Figure 1.3: Retail Real Estate Leases Grow More in Suburban Areas
Rent per leased square foot for commercial properties in urban, suburban, and exurban jurisdictions, 2015-2021
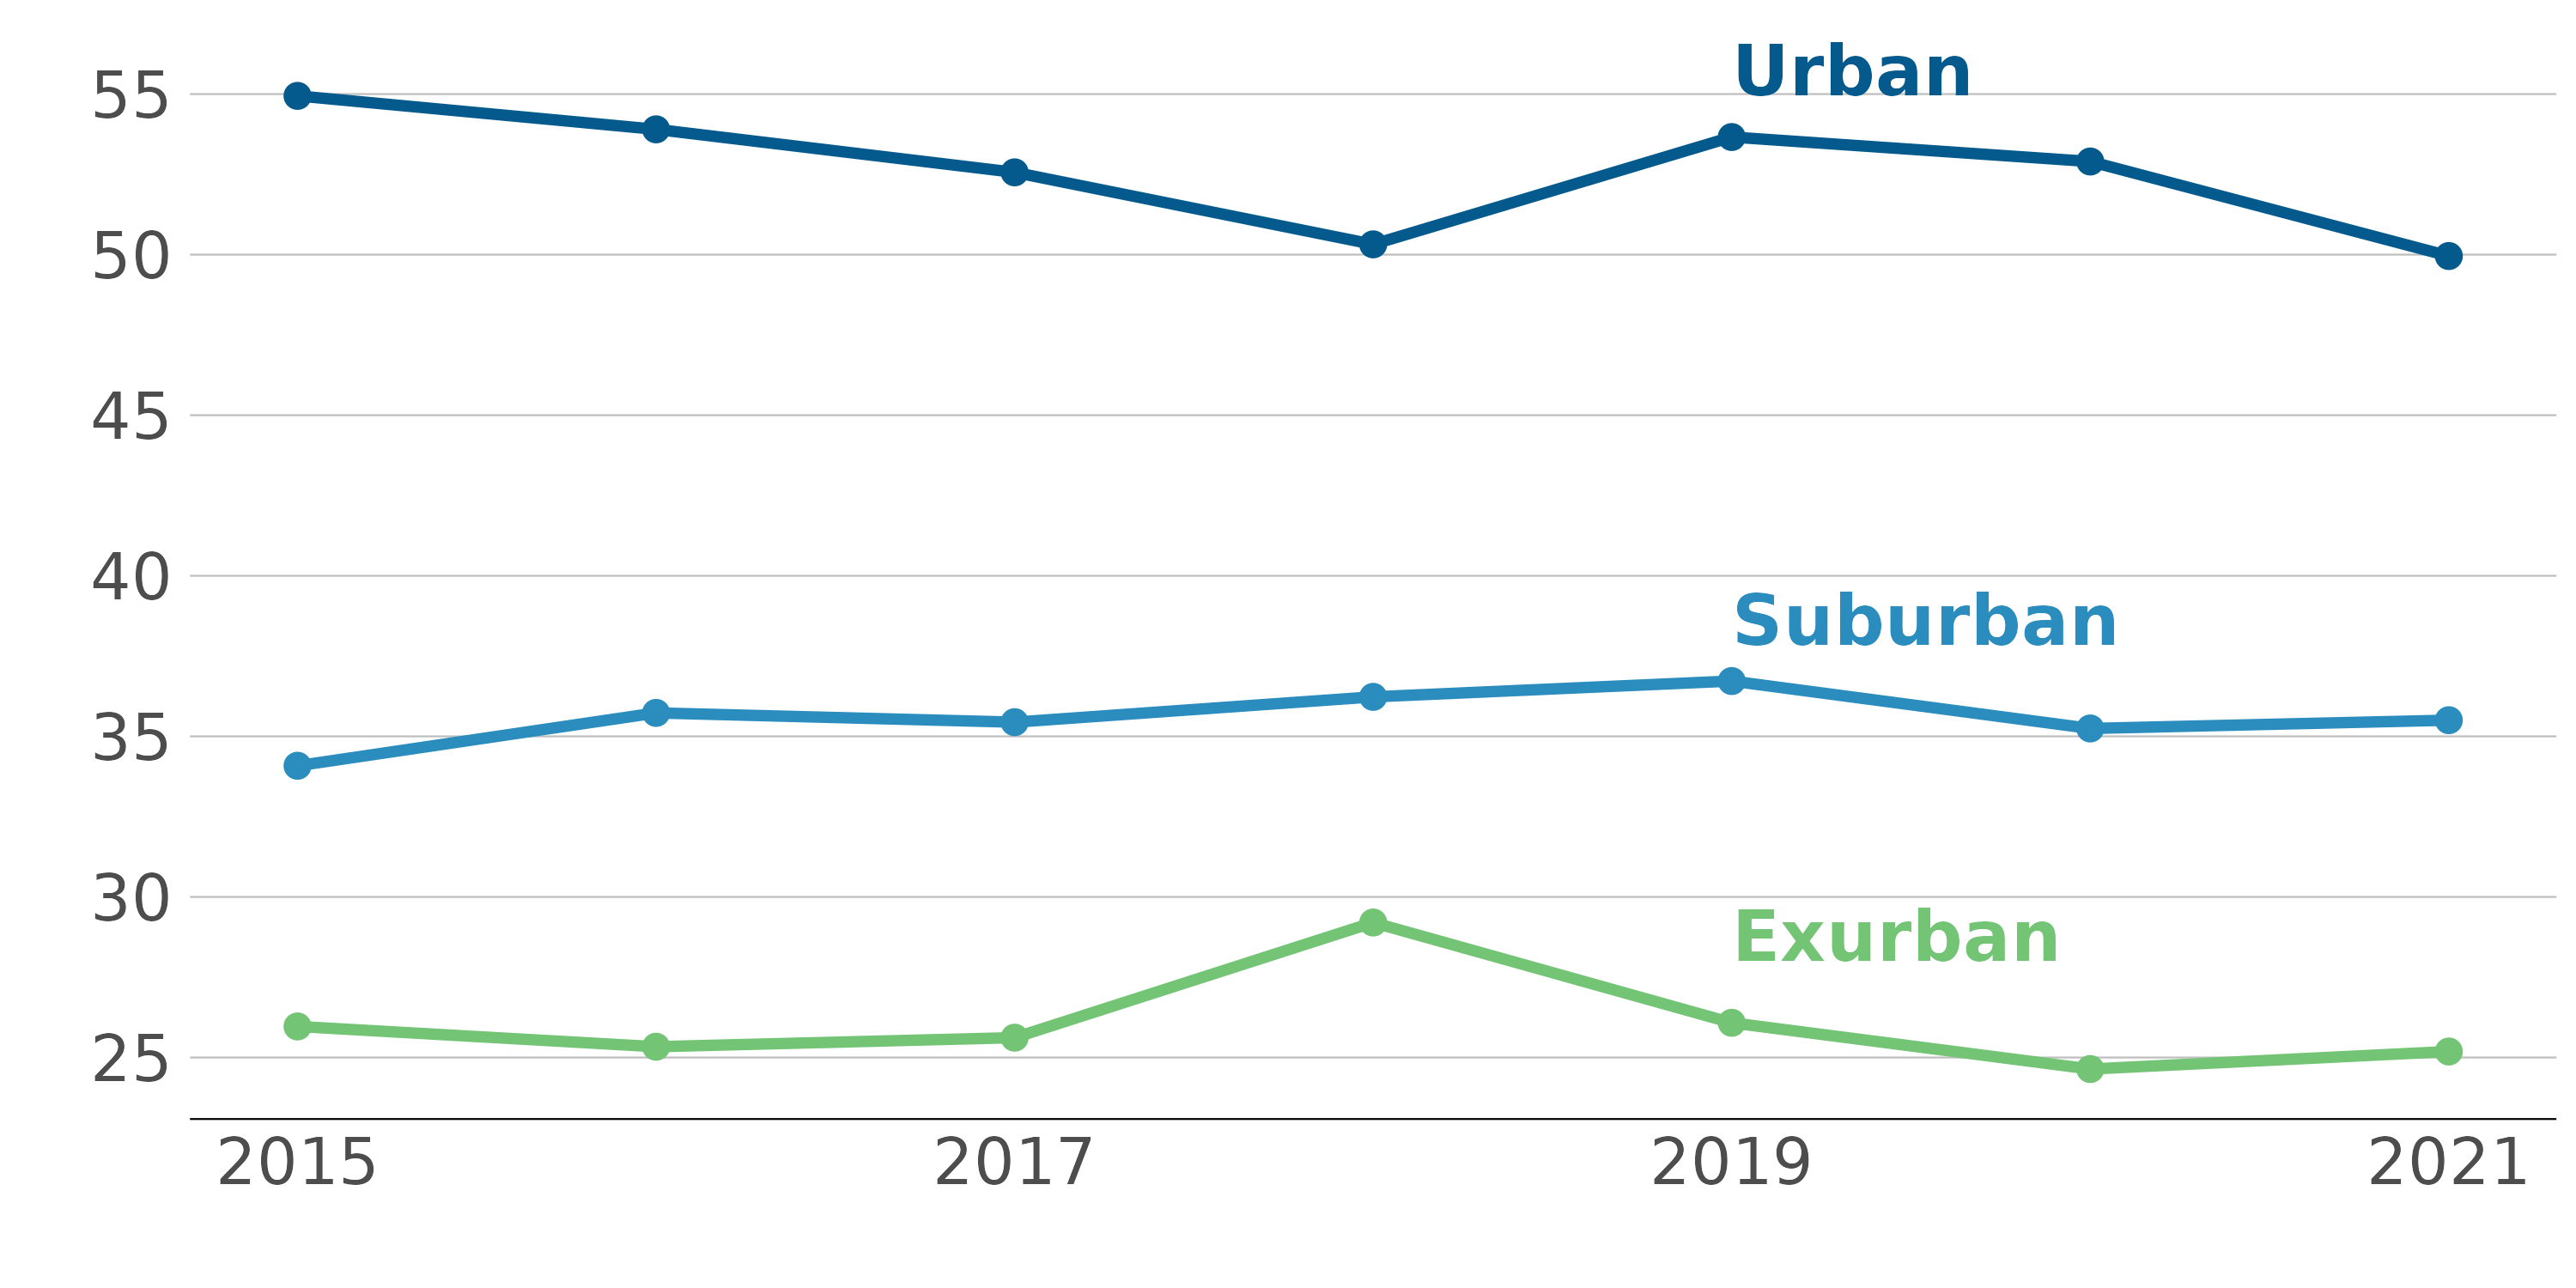
Notes: Our data do not extend past 2021. Rent is asking rent per leased square foot. We aggregate lease-level data into urban, suburban, and exurban jurisdictions.
Source: CoStar lease data.
Along with catalyzing trends in the residential rental market, the COVID-19 pandemic and the rise of remote work have also reshaped the demand for commercial real estate in the Capital Region. As companies reevaluate their office space needs and residents shift away from dense urban centers, the demand for both office and retail properties has moved away from urban jurisdictions.
Figure 1.3 shows that retail rents in urban jurisdictions are significantly higher—almost twice as high as in suburban and exurban areas. However, this urban retail rent premium has declined after the pandemic. In 2021, retail rents in suburban and exurban jurisdictions increased, while urban retail rents declined, suggesting a relative weakening in demand for city-center retail spaces.
To evaluate whether this shift in retail value to suburban and exurban areas holds for office spaces as well, Figure 1.4 shows the rent in urban relative to exurban and suburban jurisdictions (measured as the ratio of the median sale price per square foot in urban areas divided by the median price in suburban and exurban jurisdictions).
In 2016, a square foot of urban commercial real estate leased for more than 2.6 times a square foot of suburban or exurban commercial real estate. However, after 2020, the value of commercial real estate in urban areas has declined relative to suburban and exurban jurisdictions. In 2024, a square foot of urban real estate is still priced higher than its suburban and exurban counterparts – but now 1.8 times higher, not 2.4 times higher.
Figure 1.4: Commercial Rent in Urban Jurisdictions Has Fallen Relative to Non-urban Jurisdictions
Median commercial rent in urban jurisdictions divided by median commercial rent in non-urban jurisdictions, 2016-2024
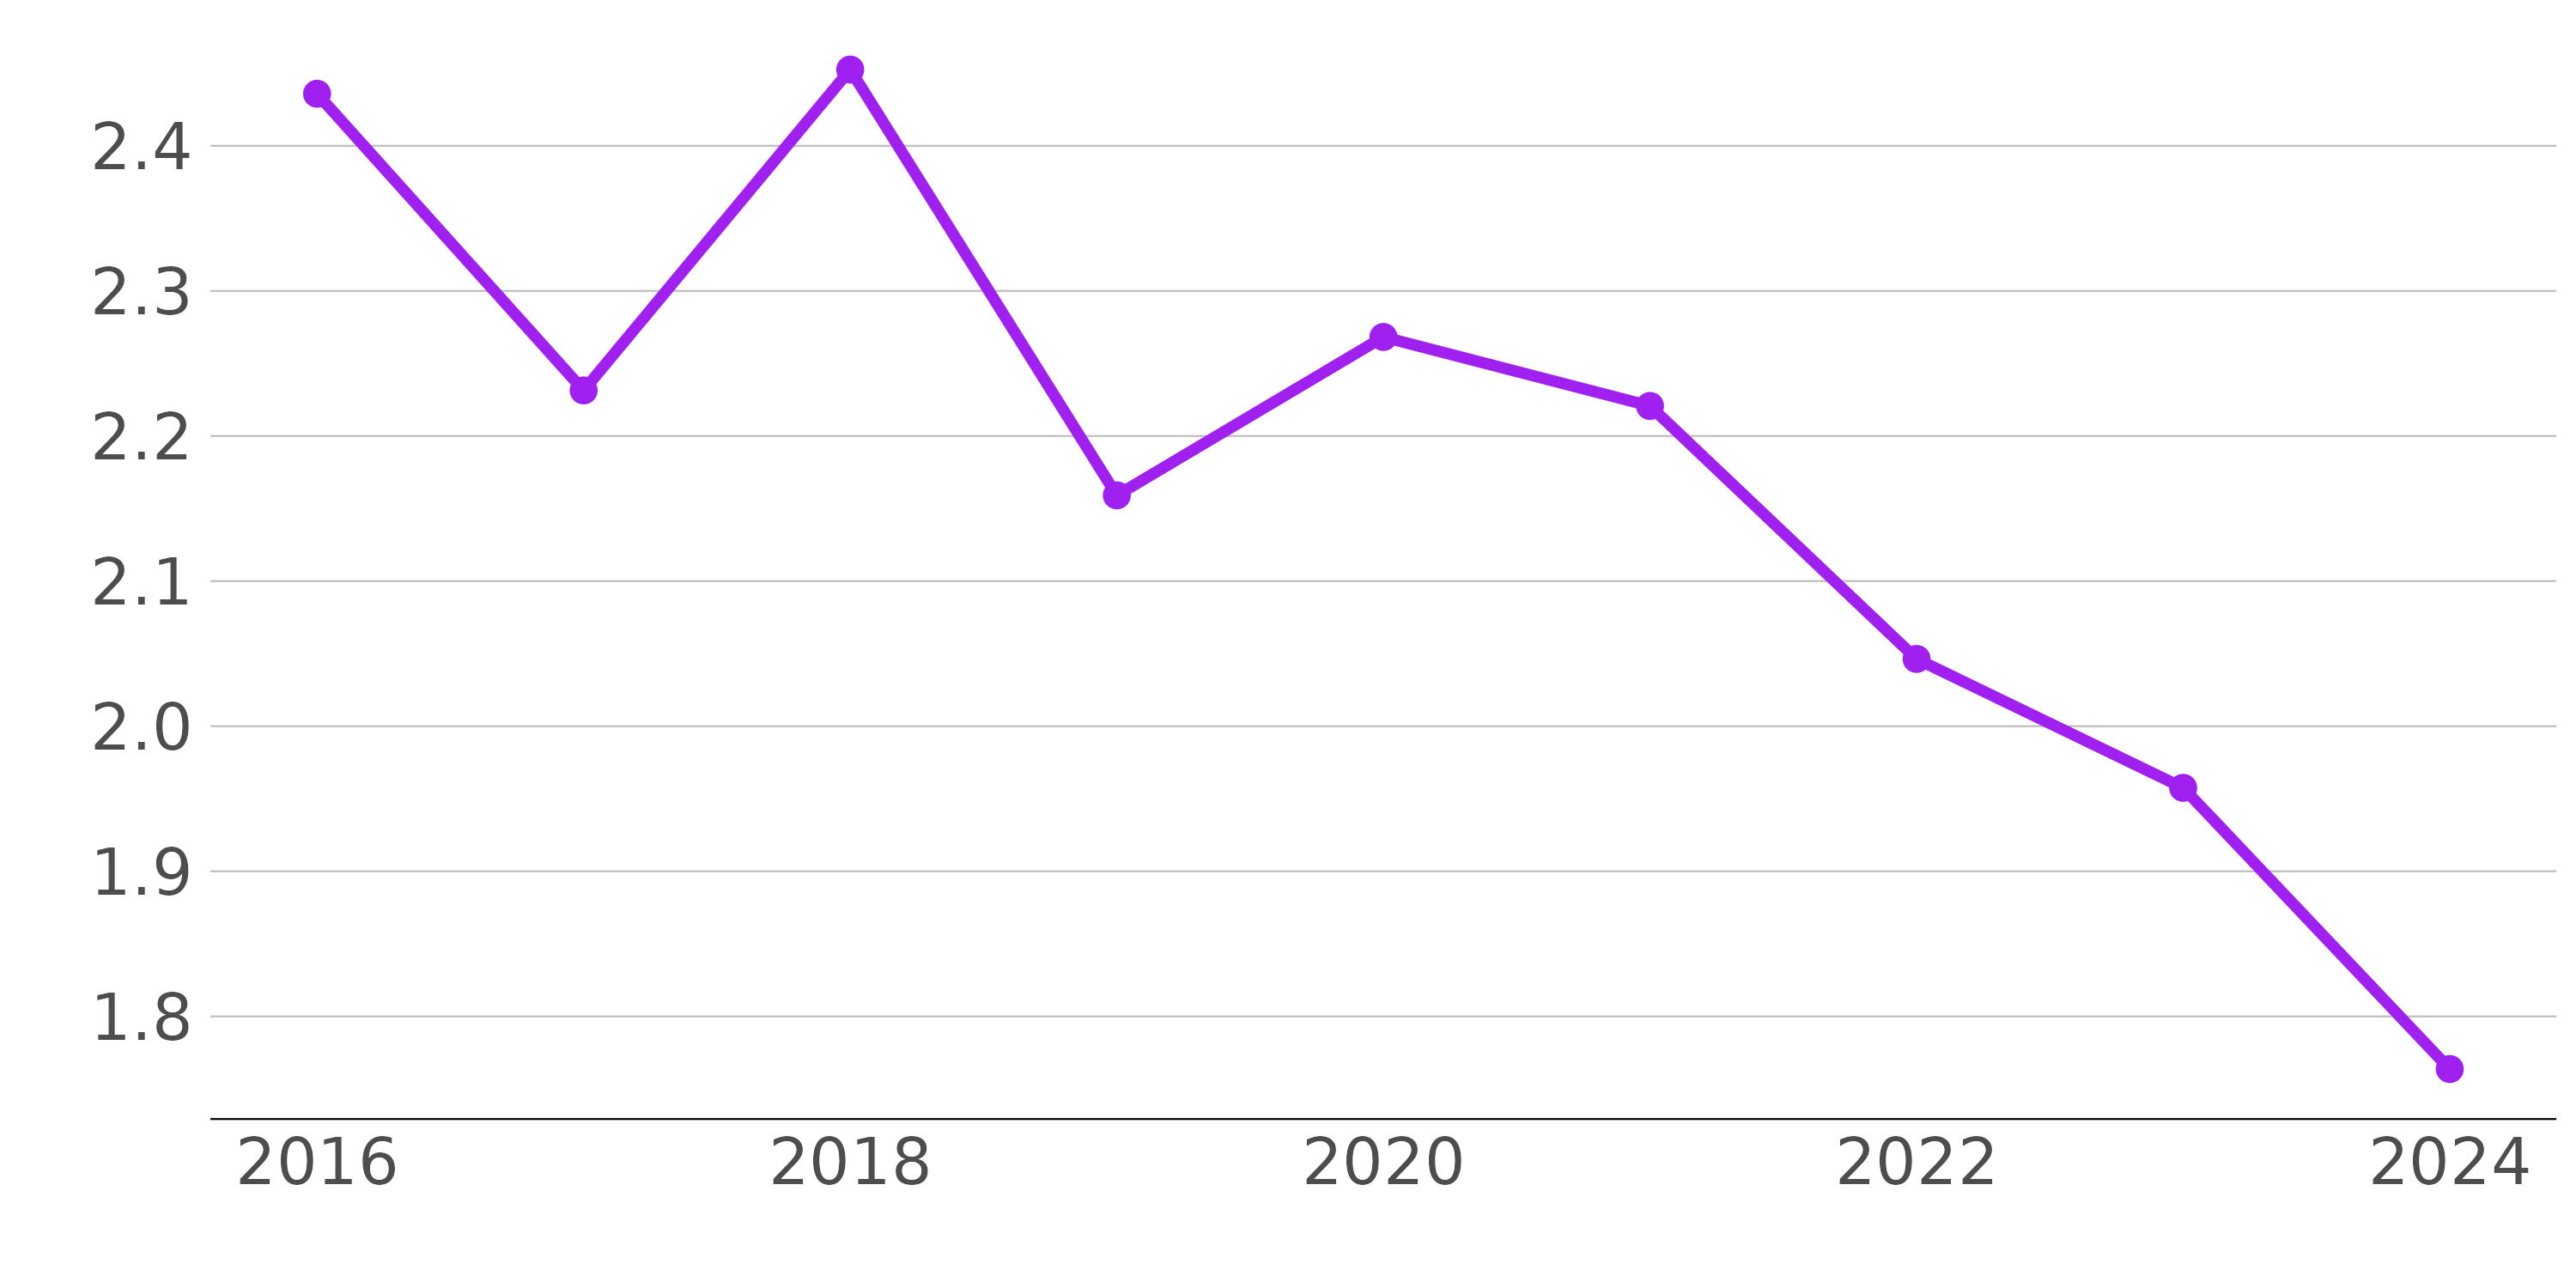
Notes: Ratio of median commercial rent in urban versus non-urban jurisdictions. We do not include Falls Church City, due to missing data.
Sources: Bright MLS data.
One potential solution to an oversupply of urban office space is to make some of this office space into housing, medical space, or some other kind of space the market demands. While developers cannot affordably convert all urban office space to residential uses, developers and policymakers have already tried to move in this direction.
Figure 1.5: Interest in Office-to-Residential Conversions is on the Rise
Mentions of office-to-residential conversions in Washington Business Journal and UrbanTurf, 2015-2024
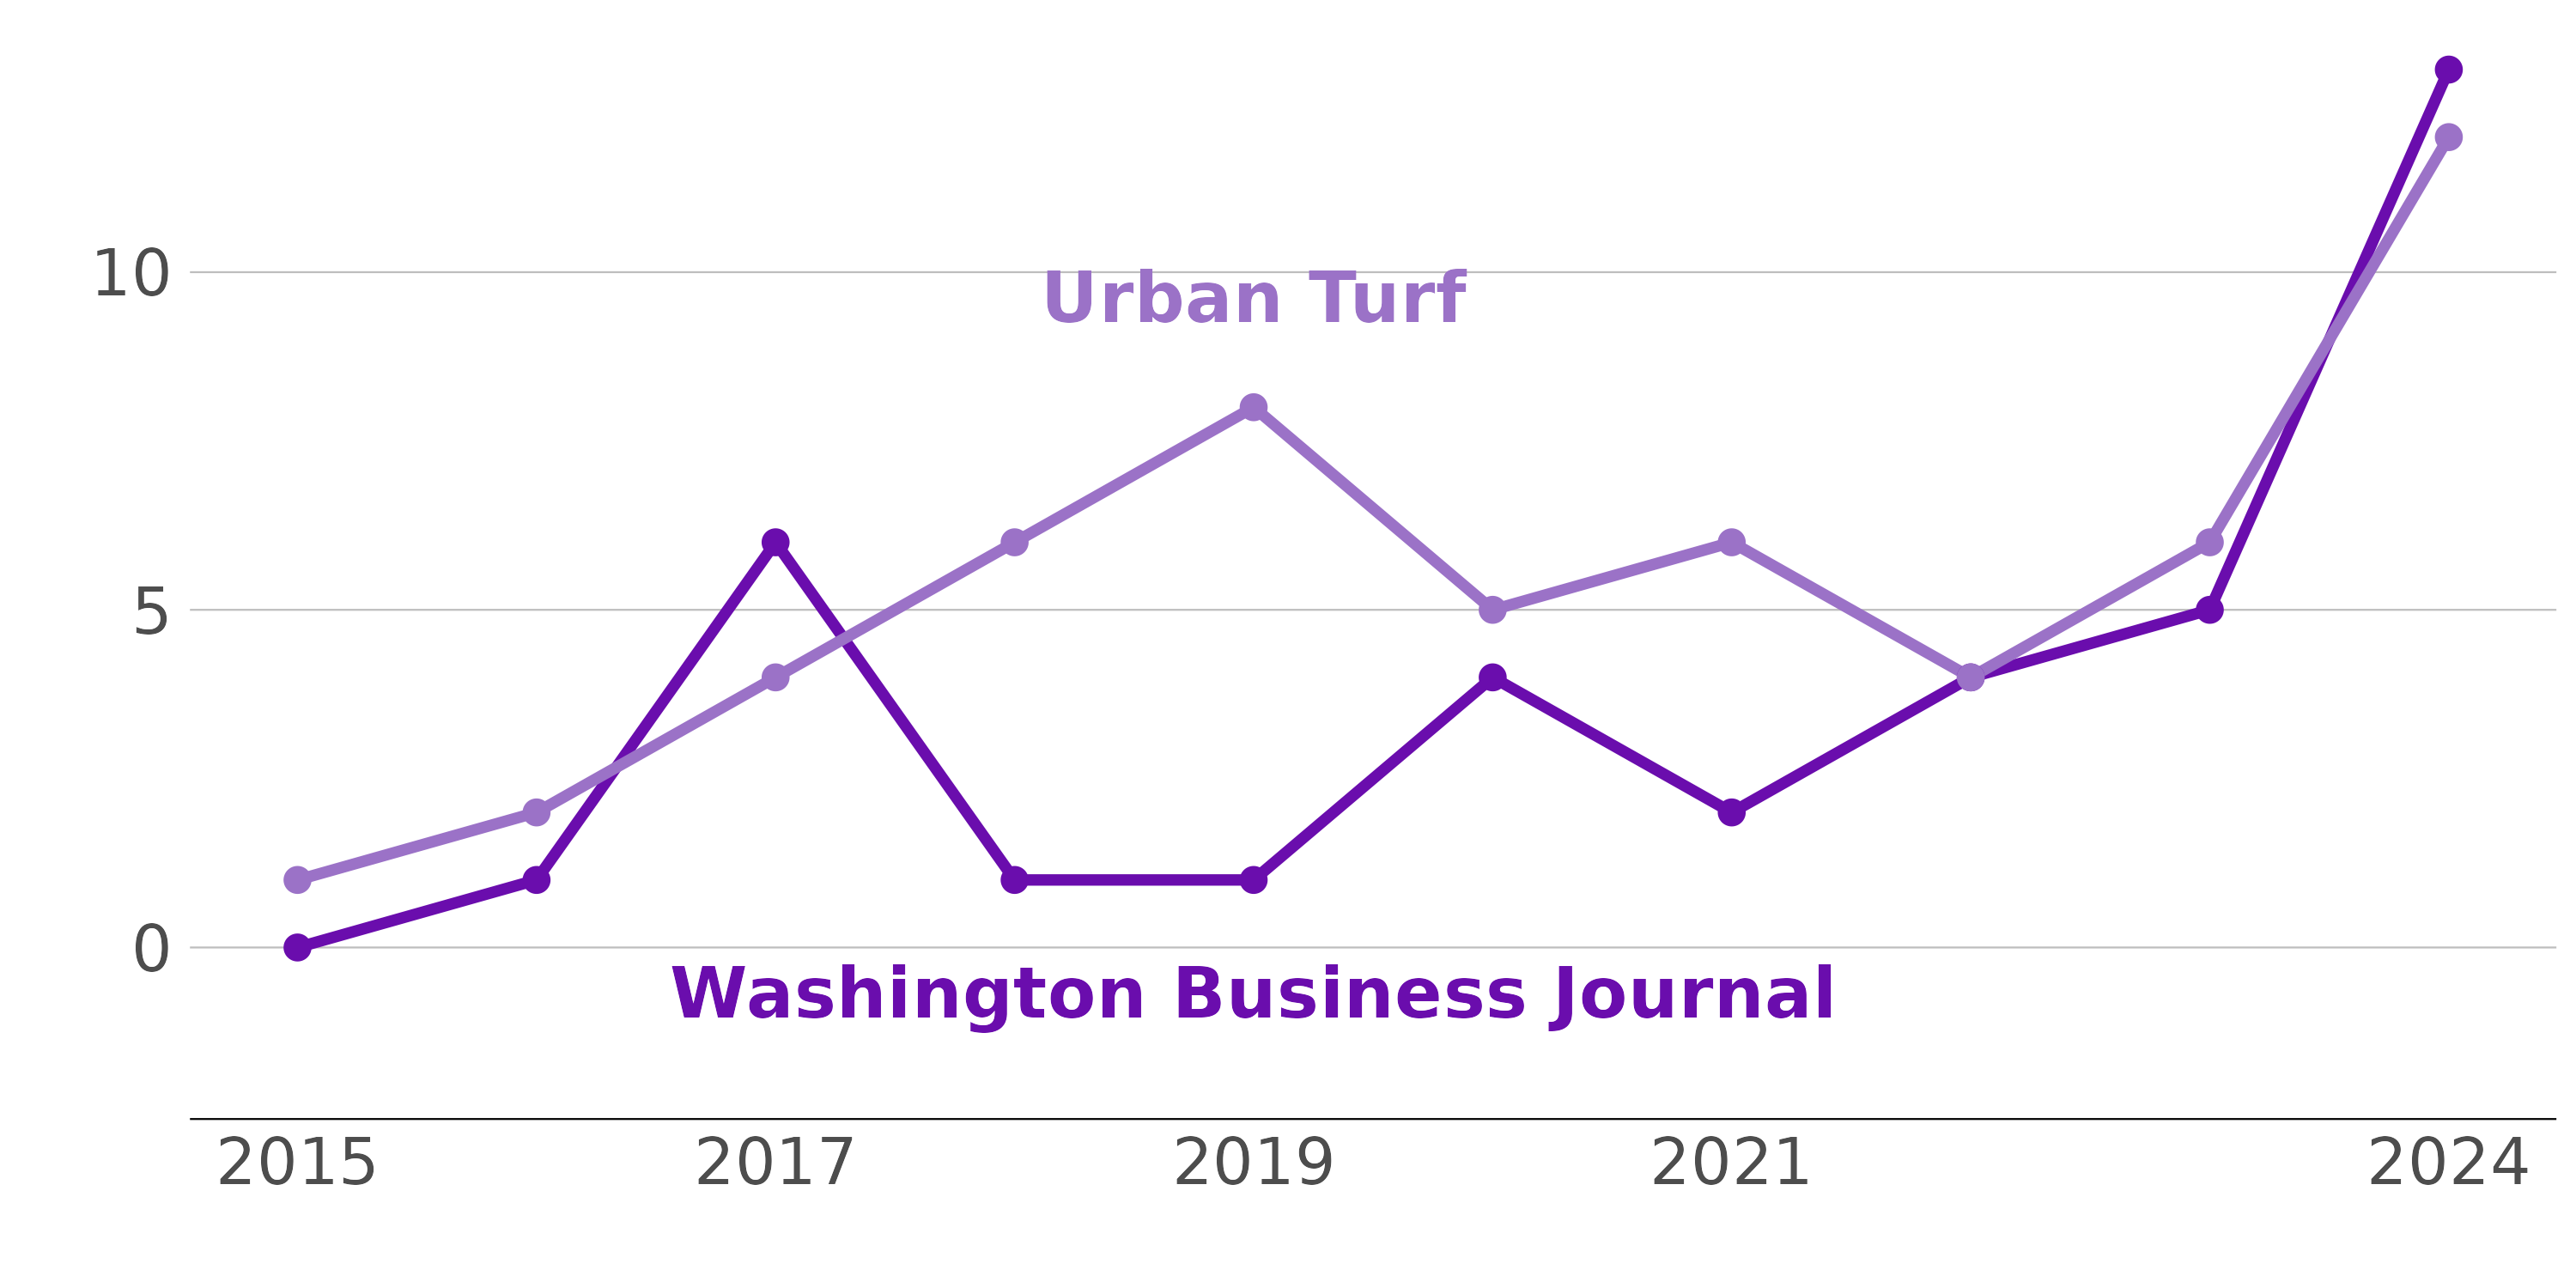
Notes: For Washington Business Journal, number of “office to residential conversion” mentions by year from 2015-2024. For Urban Turf website, results from first 6 search pages with “office to residential conversion” mentions in articles. Articles from years 2015 to 2024 only.
Sources: Washington Business Journal, UrbanTurf Washington, DC.
We show evidence of this interest in conversion in Figure 1.5, which counts mentions of “office-to-residential conversion” in two local business news sources – the Washington Business Journal and real estate website Urban Turf. Mentions have sharply increased from 2015 to 2024. This trend is not unique to the Capital Region. Major cities such as New York and London are actively pursuing office-to-residential conversions to address housing shortages and revitalize urban areas.
While these projects present a promising solution to declining office demand and rising housing costs, they also come with structural, financial, and regulatory challenges. Office buildings require significant modifications to meet residential standards, and zoning laws can complicate conversion efforts. However, despite these hurdles, the increasing attention on conversions reflects a proactive response to changing market conditions. Thus, successful implementation holds out the promise of revitalizing the urban core while at the same time increasing the supply of housing in high-demand jurisdictions.
These office-to-residential conversions are not an exclusively urban phenomenon. They therefore have the potential to help fight rapidly rising residential housing costs in suburban areas as well. For example, in Reston, developer EYA is proposing to replace 1980s and 1990s era office buildings with almost 1,000 residential units.