State of the Capital Region 2024

Crimes, Convictions, and Corrections: Long-Run Trends in the Capital Region
![]()
We appreciate support for this report from advisory council member JBG Smith.
This report is a collaborative effort from researchers at the American Enterprise Institute, Georgetown University, and the George Washington University. We are particularly grateful to the Trachtenberg School of Public Policy and Public Administration and the George Washington Institute for Public Policy for their support in reinvigorating the Center for Washington Area Studies over the past years. We very much appreciate the support of George Washington student Emma Klinge, who expertly prepared our graphics.
Introduction
This year’s State of the Capital Region report tackles an issue at the forefront of news coverage and resident concern: crime. We use a wide-angle lens to establish big picture facts about crime in the region over a long horizon. Where does it occur? How much? What resources do we use to fight it?
To compare across the 24 regional jurisdictions, we focus on homicides in Chapter 1. This most severe of all crimes occurs almost exclusively in the urban parts of the region, as Introduction Figure 1 shows. Even among the most urban jurisdictions of the District of Columbia, Arlington and Alexandria, homicide is exceptionally concentrated in the District of Columbia. While there are notably fewer homicides than the early 1990s peak, the homicide rate is as high now in the District as it was in the mid-1980s.
Figure I.1: Homicides Substantially Lower than During the 1990s, But Increasing in the District and Prince George’s.
Homicides per 100,000 residents from 1980 to 2021 by largest Capital Region jurisdictions.
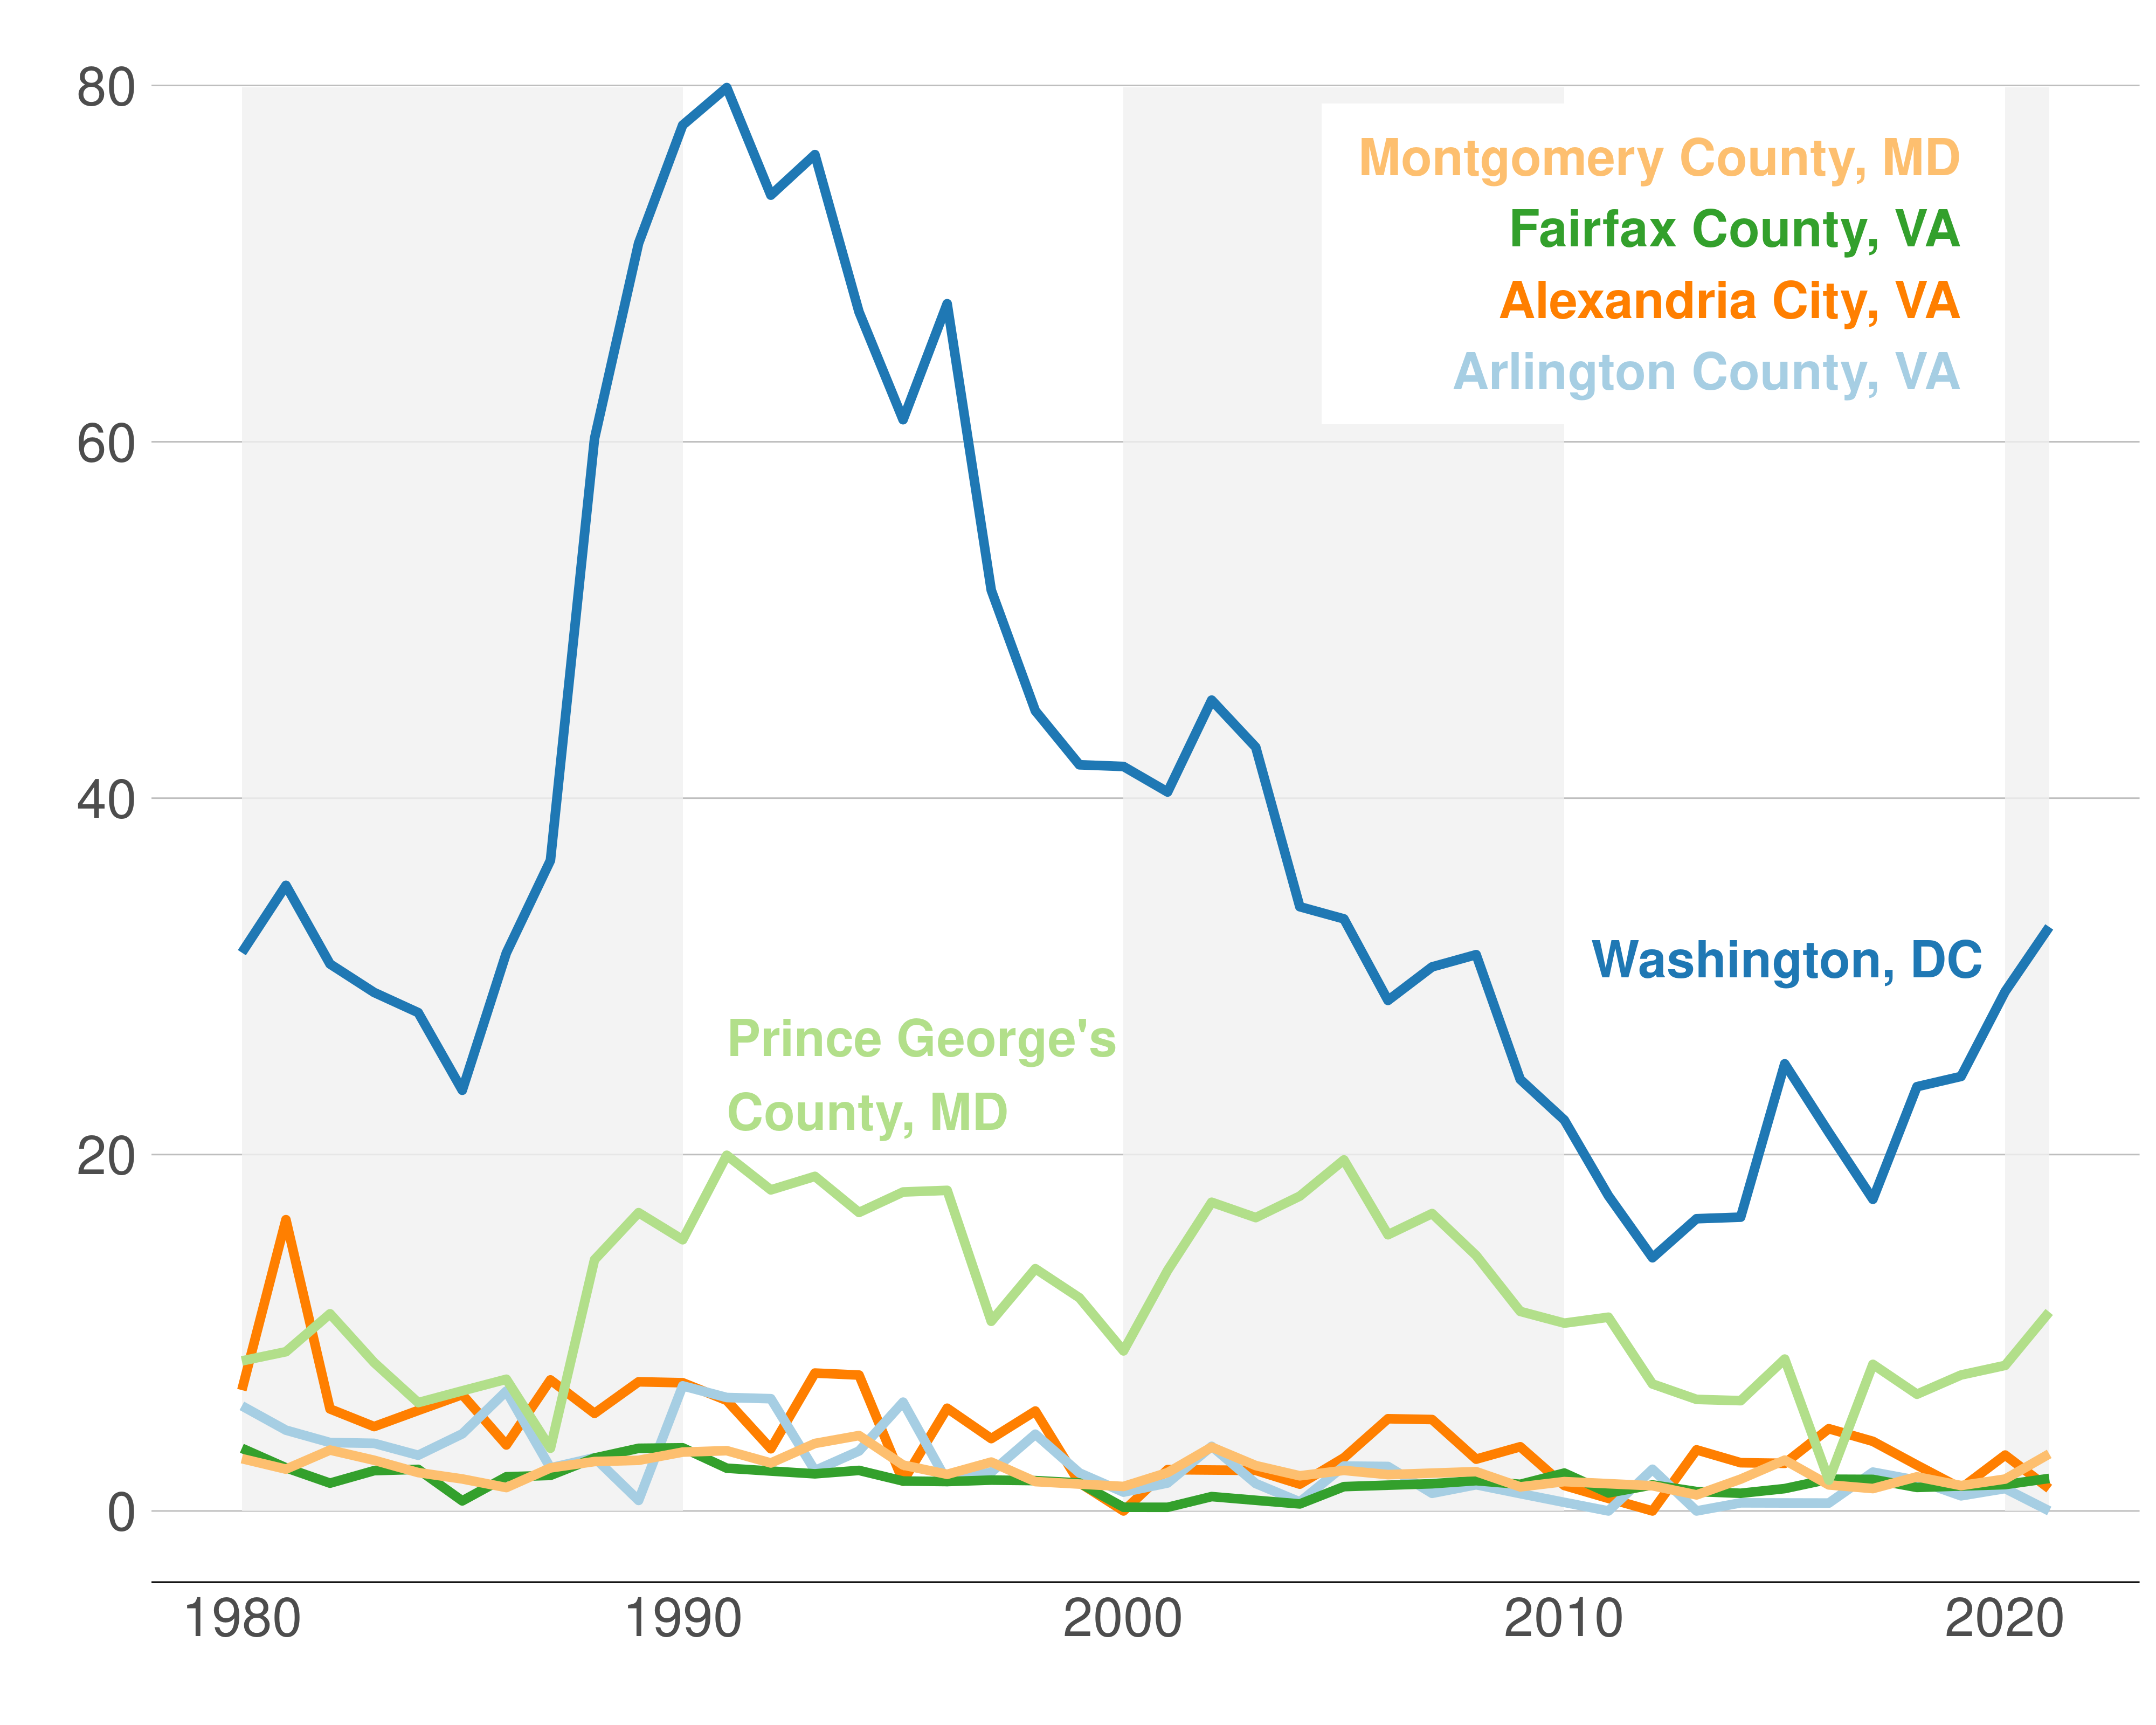
Source: UCR, 1980-2021.
Furthermore, Figure 2 shows us that homicides in the District have been on a gradual, continuous increase since 2013. In fact, homicides went up by more than 150 percent in the decade following 2013. Thus, factors associated with the pandemic do not explain this long-run increase.
Figure I.2: Homicides on the Rise in the District as Early as 2015.
Total homicides by quarter in the District, 2008 to 2024.
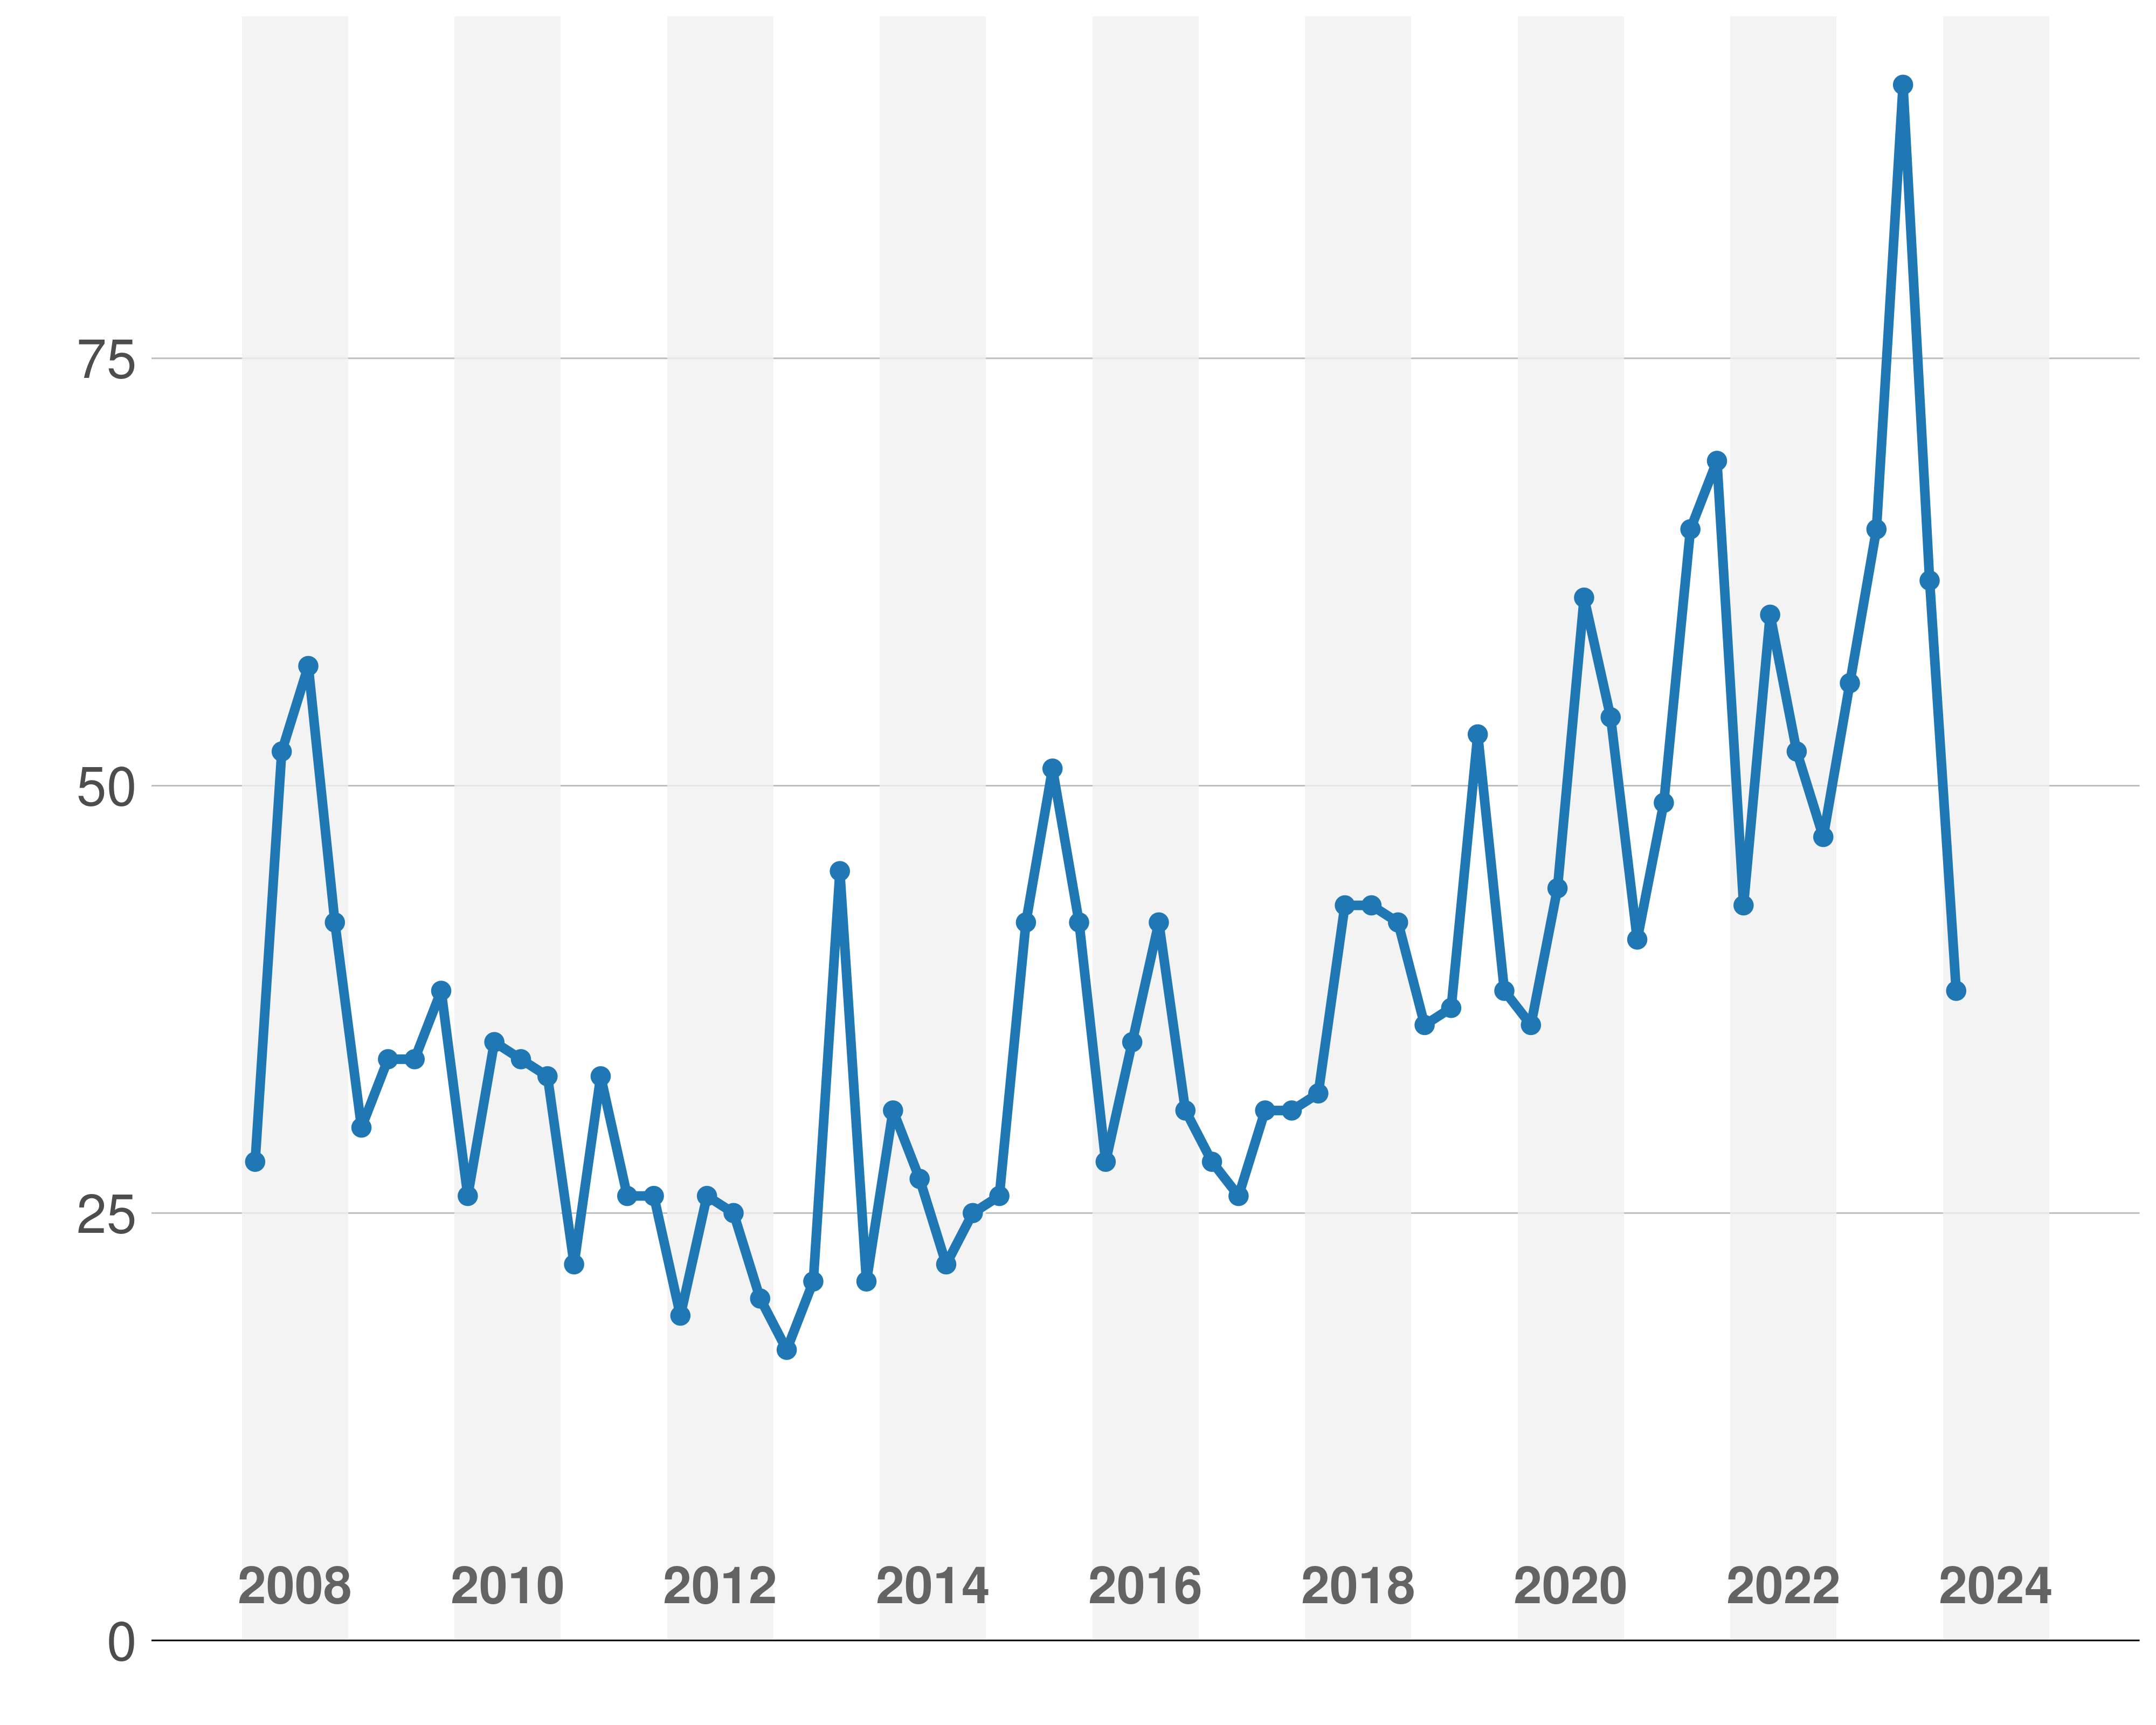
Source: DC Open Data, 2008-2024.
At the same time, police staffing per resident has been flat in suburban jurisdictions and declining in the District, as we show in Chapter 2. Finally, in Chapter 3, we examine prosecution, incarceration and recidivism, concluding that the limitations in publicly available data are so severe that it is hard to undertake meaningful regional analysis.