Chapter 1: Homicides
We begin with an overview of homicide rates in the Capital Region, looking first at the long run and then zooming in to more recent years and smaller areas. We focus on homicides since the definition of a homicide is consistent across jurisdictions, allowing us to compare clearly across jurisdictions. Further, virtually all homicides are reported, in contrast to other crimes, which residents underreport to different degrees across jurisdictions and time. Finally, homicides are arguably the most severe crime. The Capital Region has experienced two waves of homicides: a first wave from the early 1960s, which peaked in the mid-1970s, and a much larger second wave from the mid-1980s, peaking in the mid-1990s. Figure 1.1 shows this long-run view of homicide in the major counties in the Capital Region. The figure plots homicides per 100 thousand residents since at least 1960 for the District, the Maryland counties of Montgomery and Prince George’s, and the Virginia jurisdictions of Fairfax and Arlington counties and the City of Alexandria.
Figure 1.1: The Capital Region Experienced Two Major Waves of Homicides.
Homicides per 100,000 residents, 1936 to 2021.
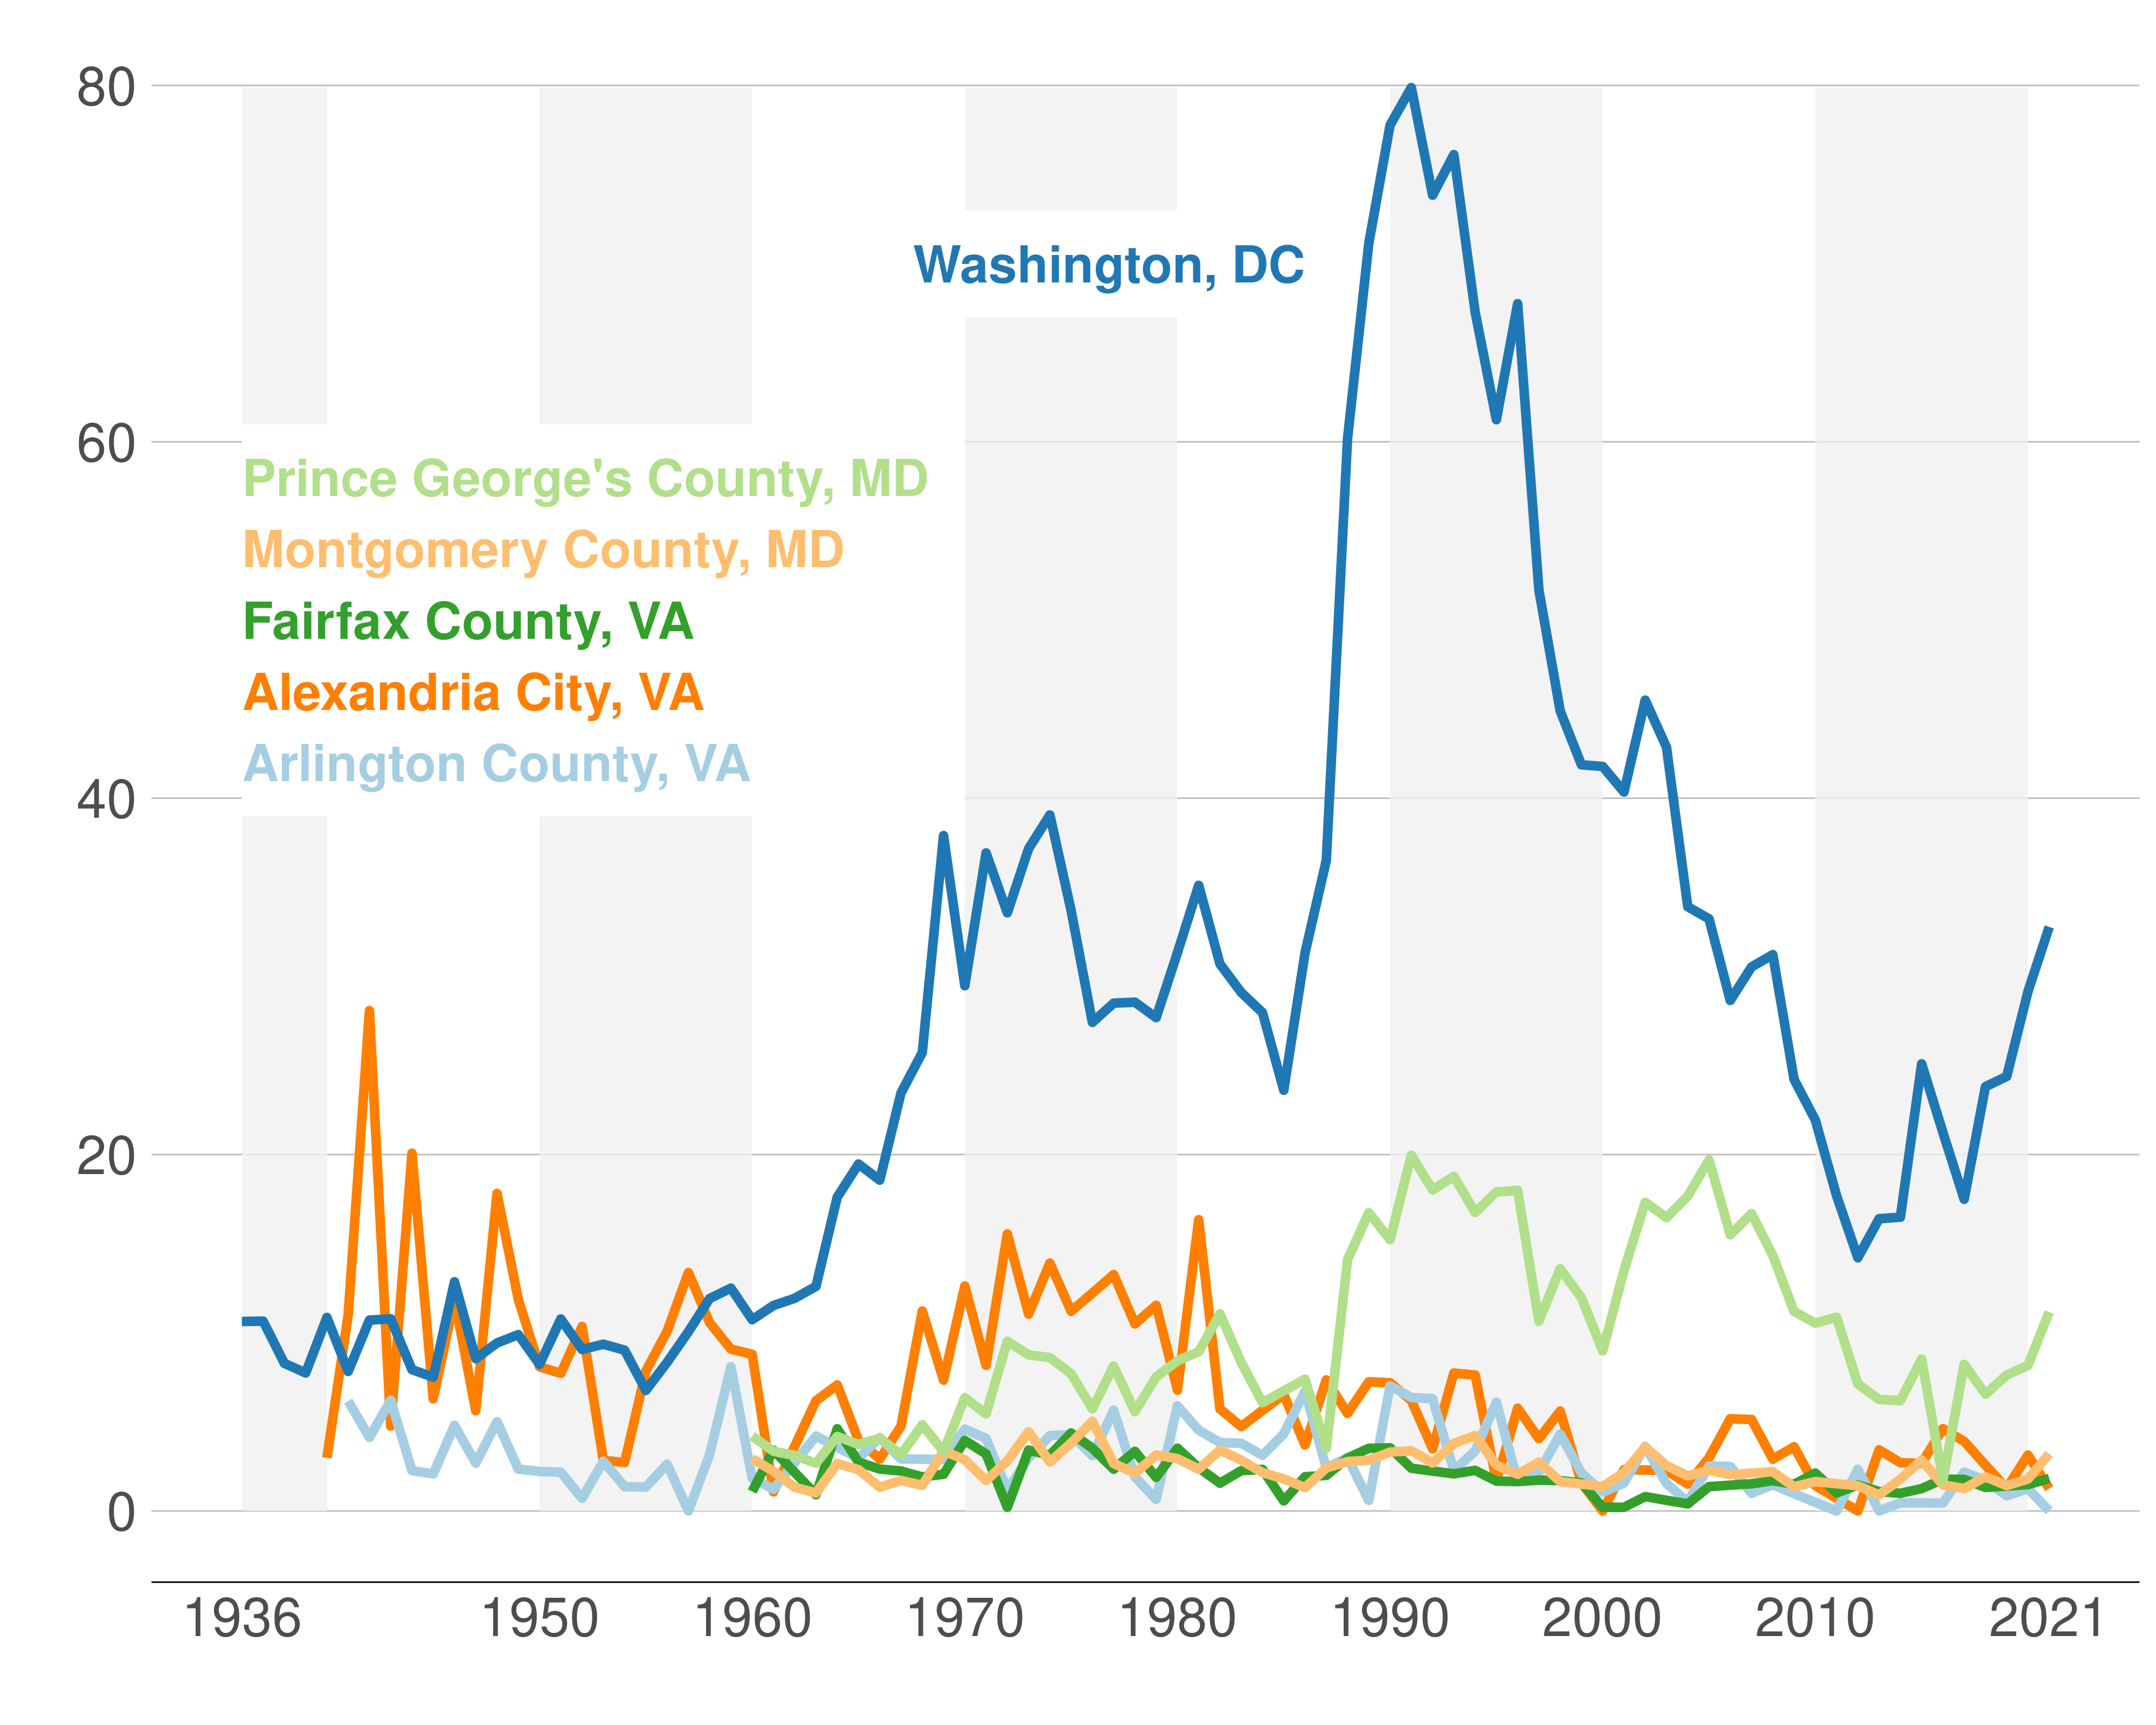
Source: UCR, 1936-2021.
Over time, the incidence of homicides has shifted east, moving away from Virginia and becoming increasingly more concentrated in the District and Prince George’s County. These areas hit all-time highs of 80 and 20 homicides per 100 thousand residents, respectively, at the beginning of the 1990s.
By and large, homicides are now at a historic low on the Virginia side of the Capital Region and in Montgomery County. At the same time, a third wave seems to have emerged since 2010 in Prince George’s County and especially in the District where, concerningly, rates are closing in on the mid-1970s levels. The homicide rate in Prince George’s County already exceeds the 1970s high.
Is this increase unique to the District, or is it a problem that is plaguing many major US cities? Figure 2 compares the District to the largest US cities of New York, Los Angeles and Chicago, to nearby Baltimore, and to rapidly growing Miami. While many of these cities have seen a moderate increase in homicides over the past decade, the increase of the last decade appears to be specific to the District.
Figure 1.2: Homicide Rates in the District Rising More Than in Peer Cities.
Total homicides per 100,000 residents annually, 2008 to 2023.
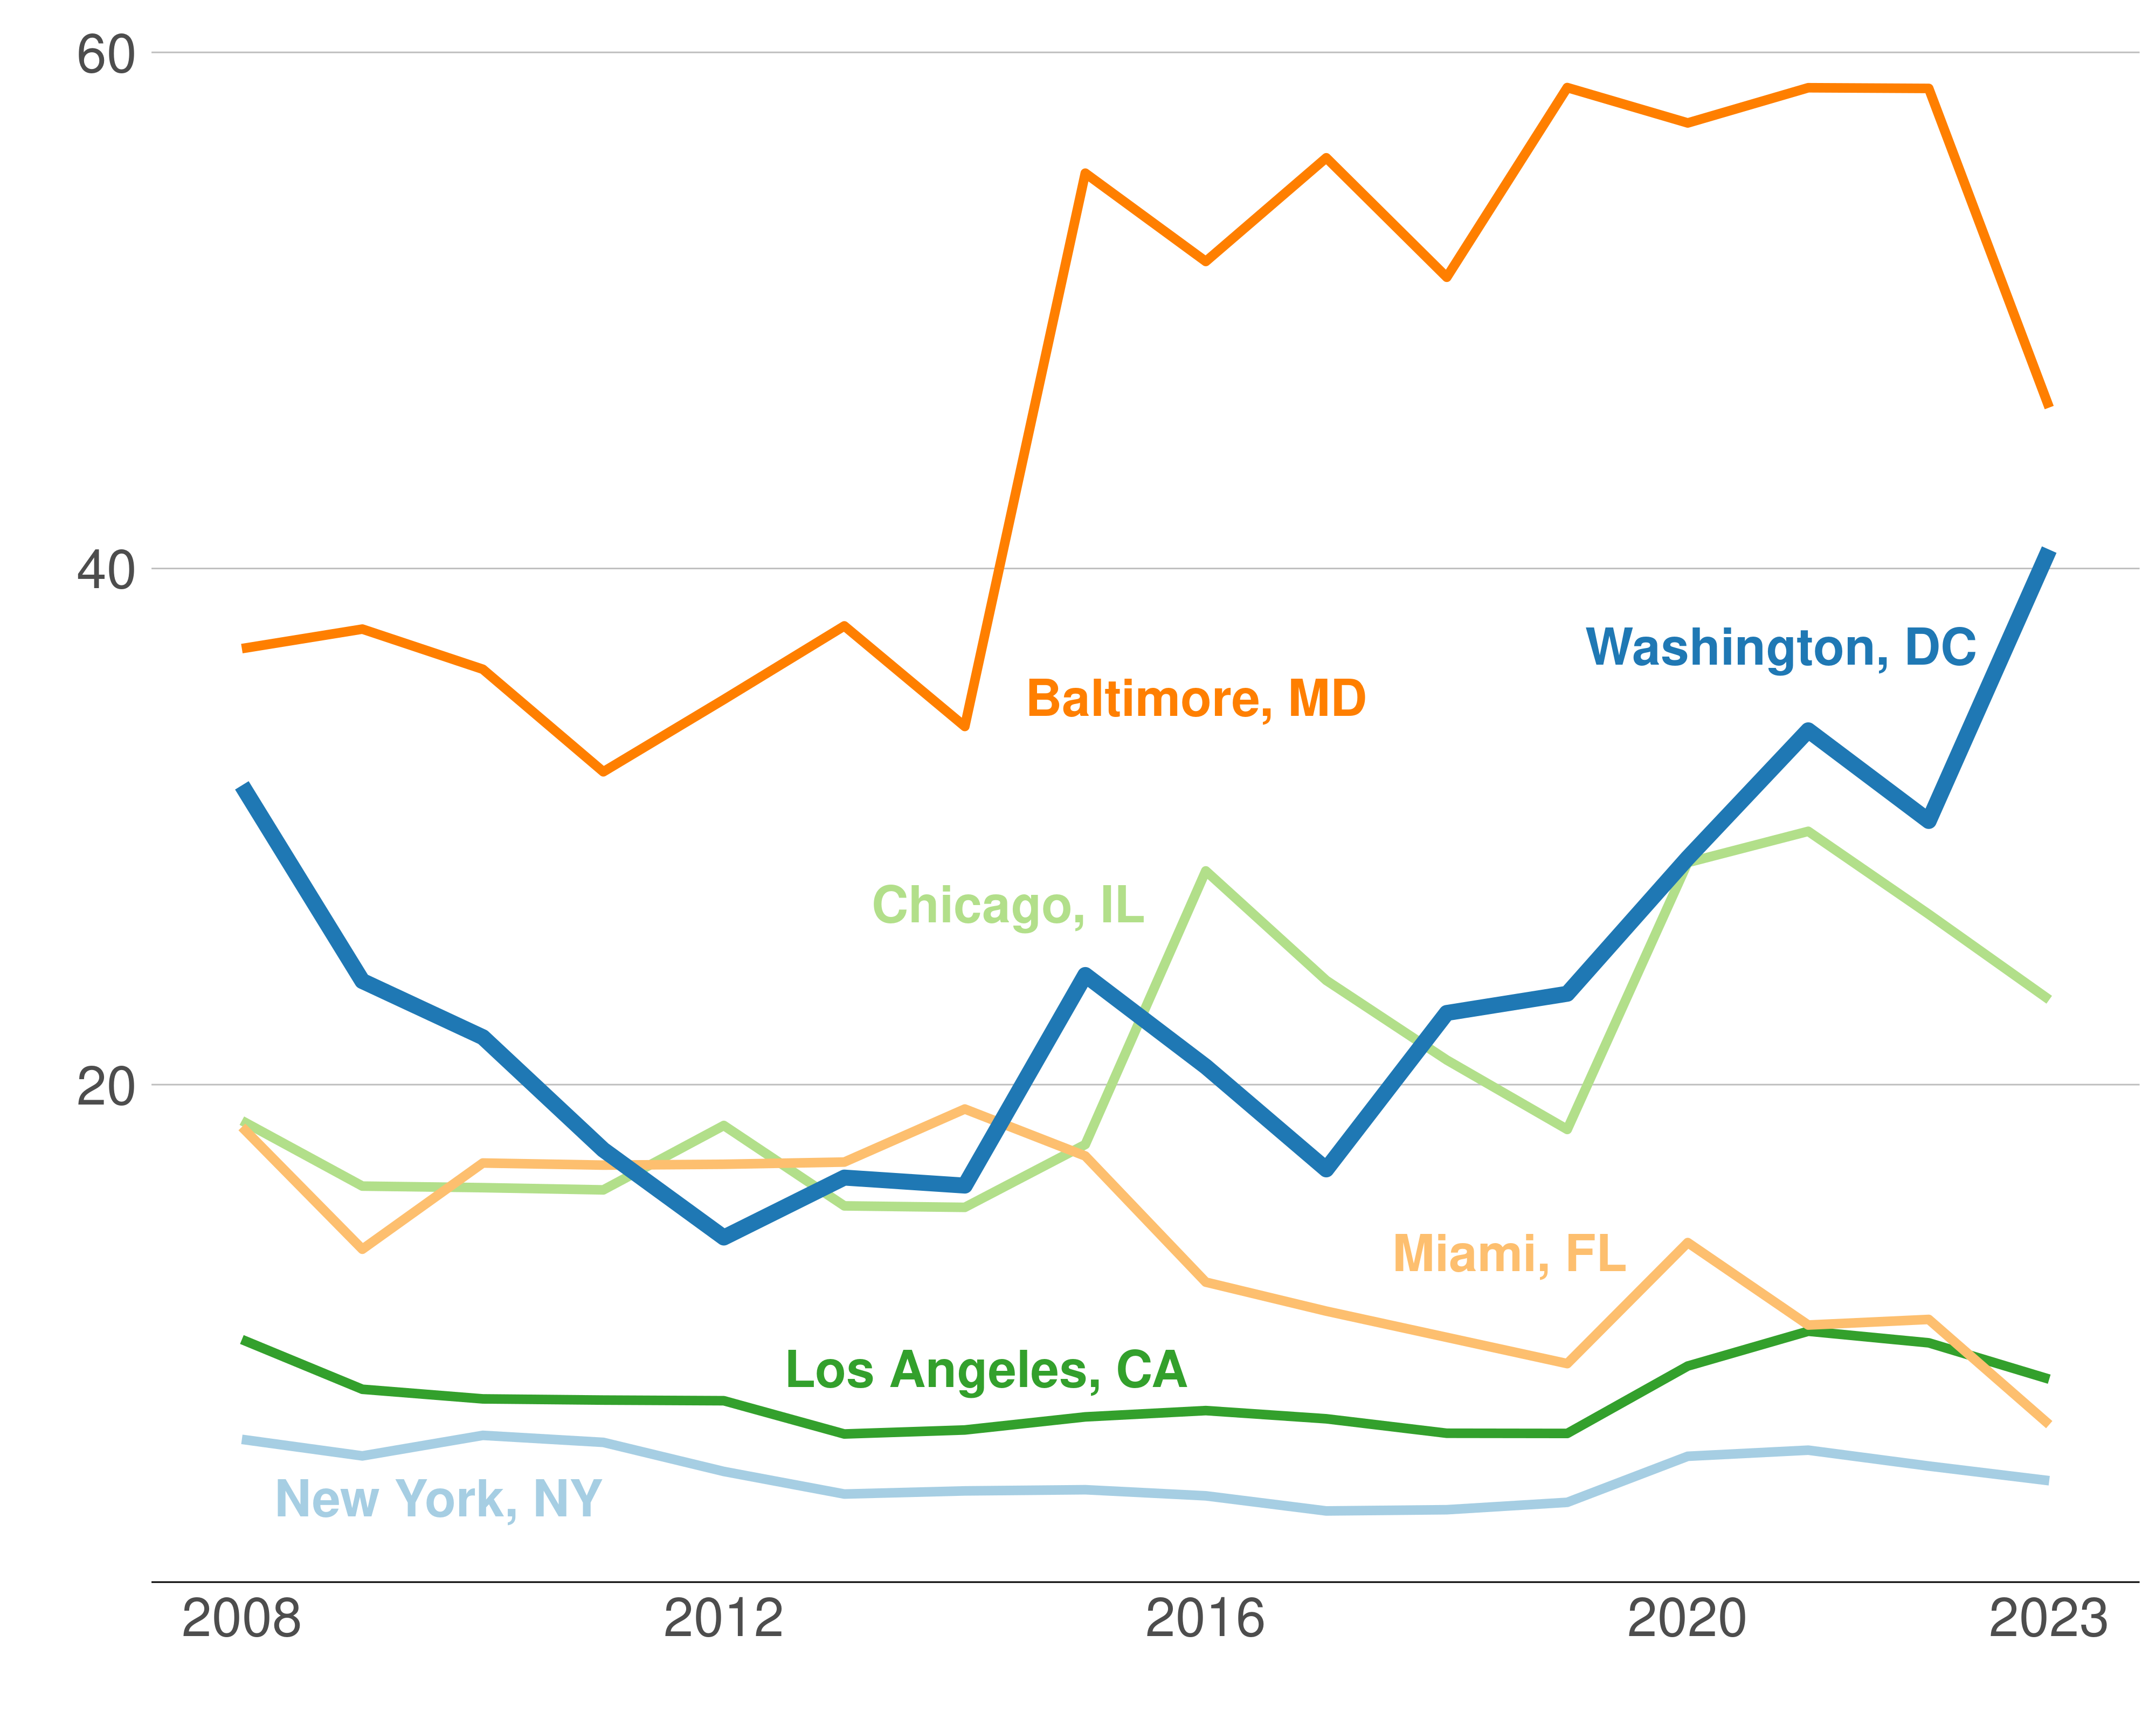
Source: UCR, 2008-2020; for 2021-2023, see Appendix 1; ACS, 2008-2019 & 2021-2022 (linearly interpolated to obtain population estimates for 2020 and linearly projected for 2023).
The recent social unrest and COVID-19 pandemic might have also affected homicide rates, so we explore this association in Figure 1.3. Here, we compare the change in homicides per 100,000 residents by jurisdiction from 2017 to 2019 (bottom line), and from 2019 to 2021 (top line). During the pandemic years, homicide rates have held steady in Arlington and Fairfax counties and Alexandria City, while growing in Montgomery and Prince George’s counties and in the District. The evidence on whether these changes constitute a departure from previous trends is less clear. While the downward trend in Alexandria has stopped, and Montgomery and Prince George’s numbers seem to have accelerated, the growth in the District, seems to be on par with the previous tendency.
Figure 1.3: During the COVID-19 Years, Homicides Increase in Washington, the District and Prince George’s County.
Homicides per 100,000 residents in 2017, 2019, and 2021 in largest Capital Region jurisdictions.
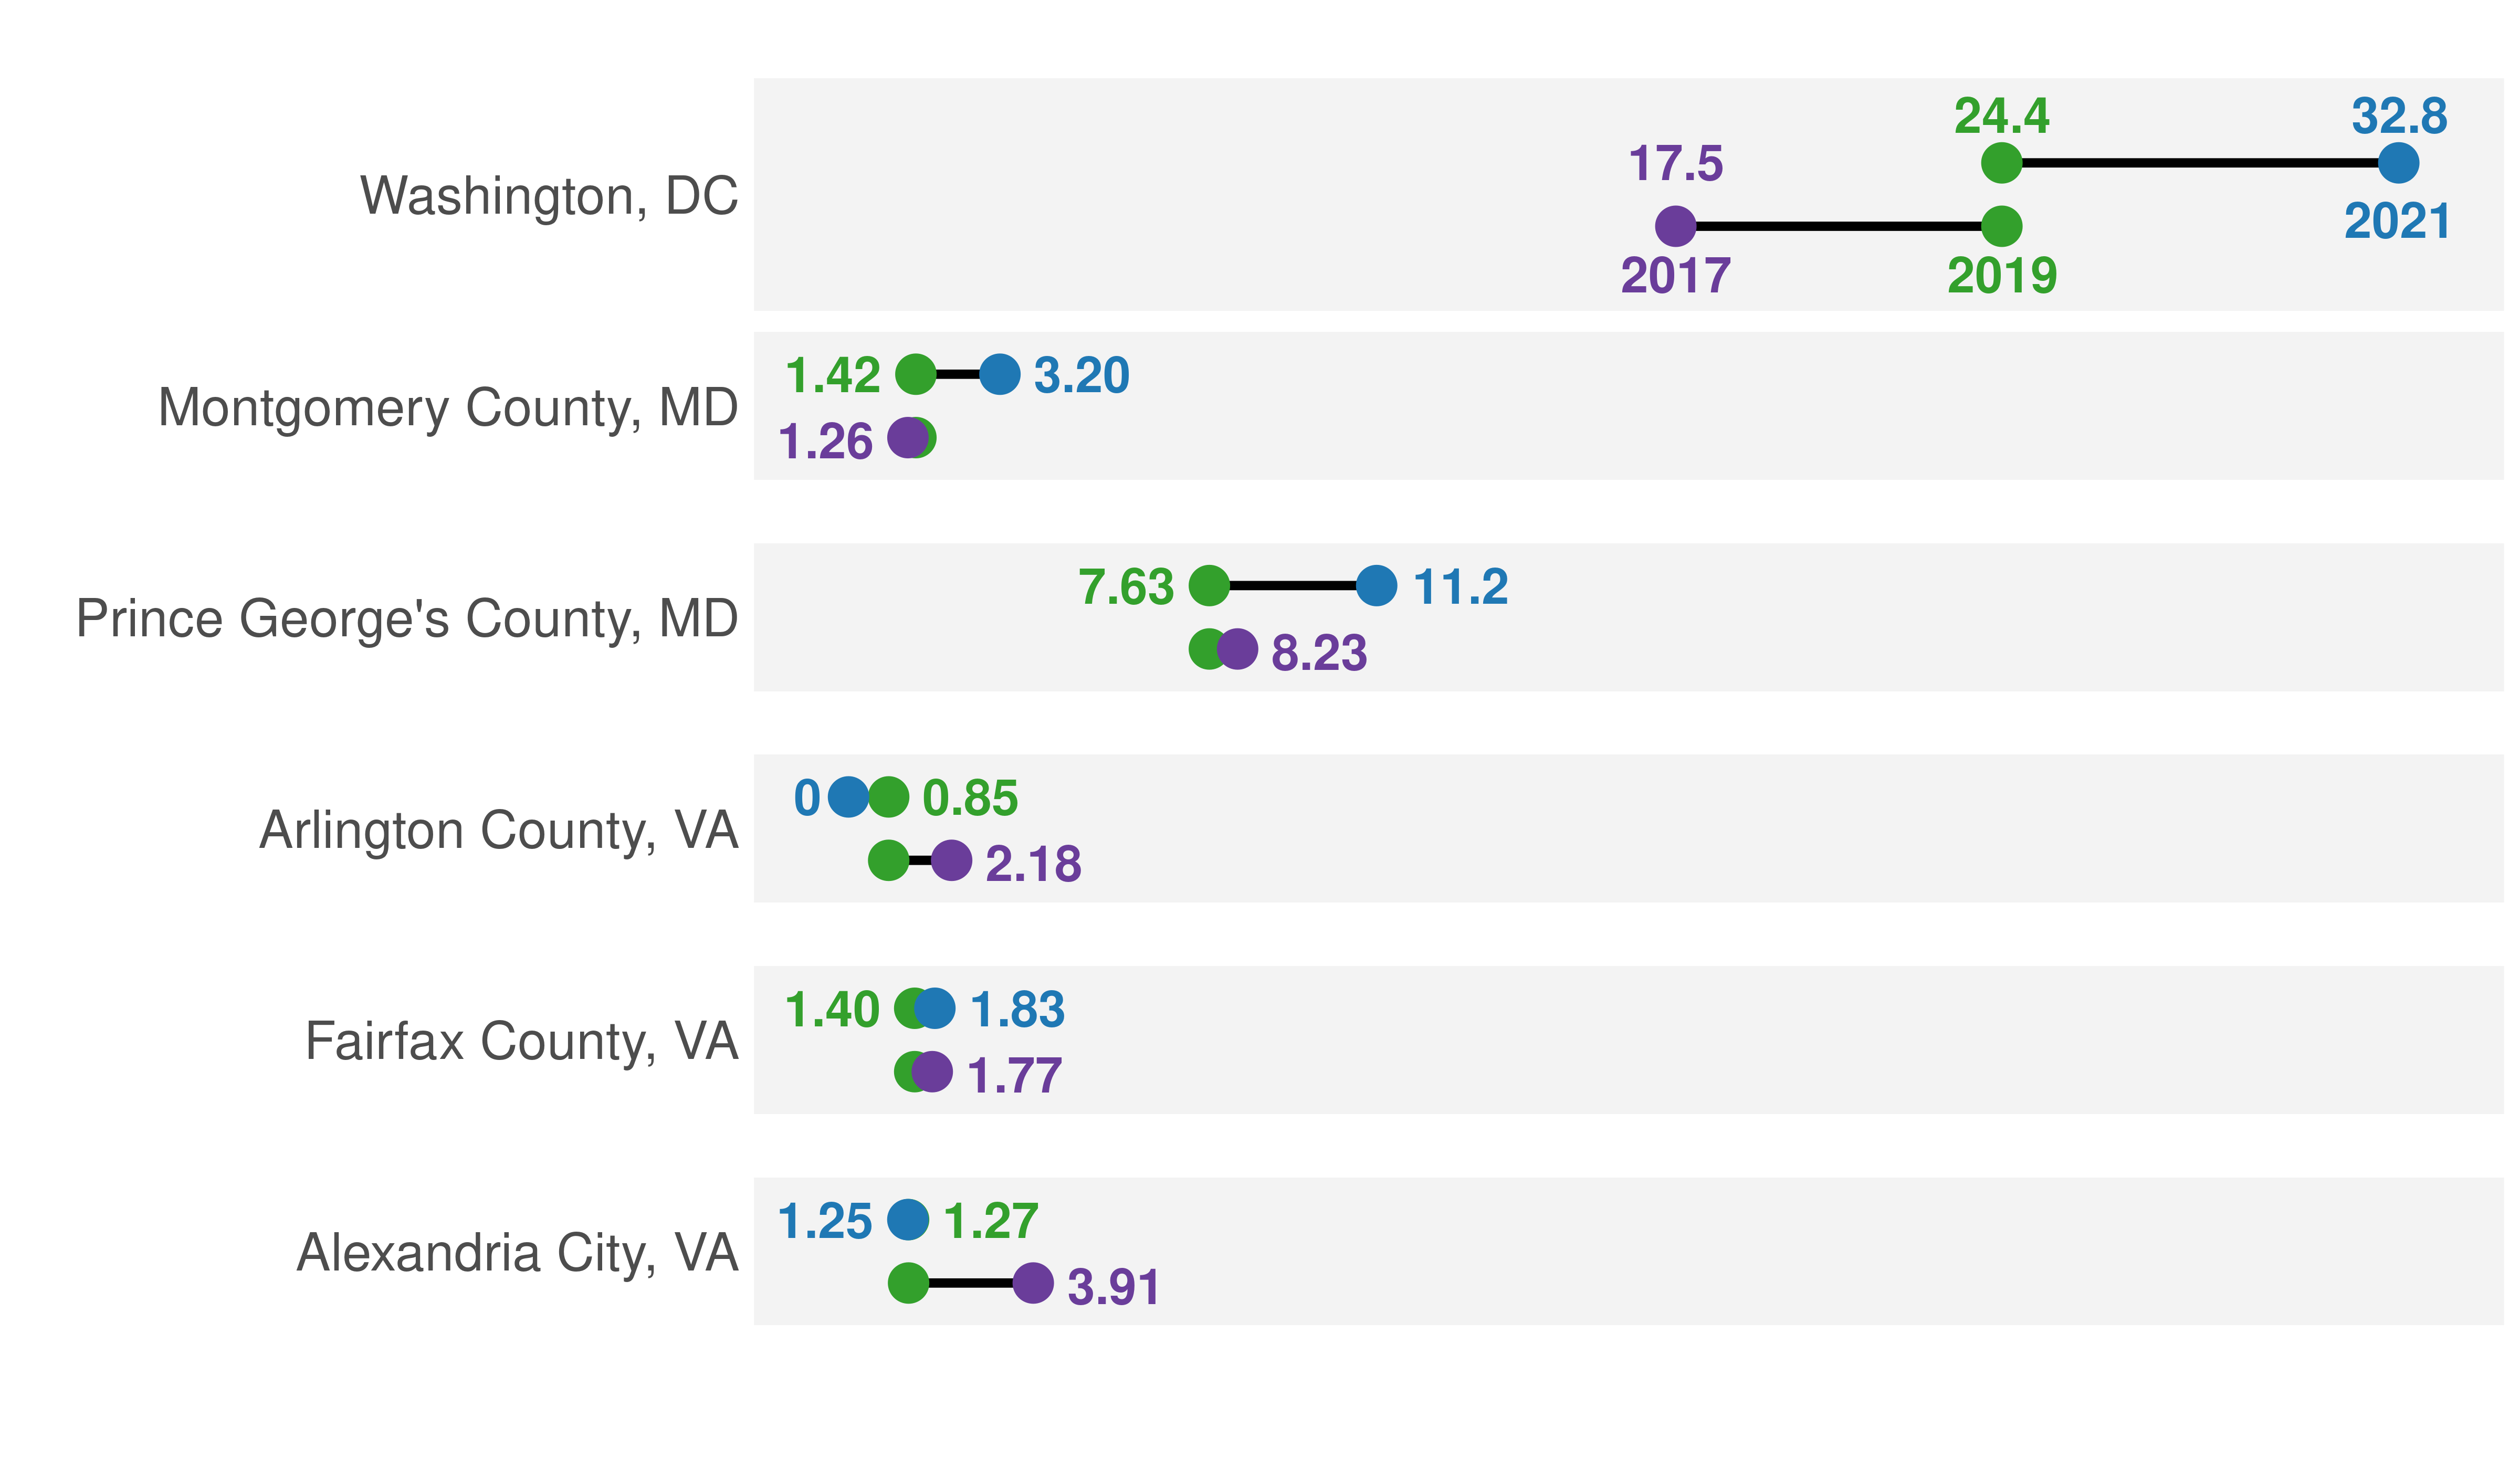
Source: UCR, 2017, 2019, and 2021.
Since counties are relatively large areas, the overall rate may not provide a fair representation of conditions on the ground. Thus we now turn to the location of homicides across neighborhoods. Figure 1.4 shows where homicides occur in the District, Prince George’s County and Montgomery County. We would include Virginia jurisdictions as well, but none of them report data that allow us to make such a map.1 Figure 1.4 color-codes neighborhoods by total homicides from 2017 to 2023, and darker colors indicate more homicides.2 Although many neighborhoods report at least one homicide, the map shows that this type of crime is concentrated in a few locations. The eastern portion of the District, and the areas along the boundary of the District and Prince George’s County see a disproportionate amount of homicides, while most neighborhoods in these three jurisdictions are essentially untouched.
Figure 1.4: Homicides Are Mostly Concentrated Along the District-Prince George’s County Boundary.
Total homicides by neighborhood, the District, Montgomery County and Prince George’s County, February 1, 2017 through July 5, 2023.
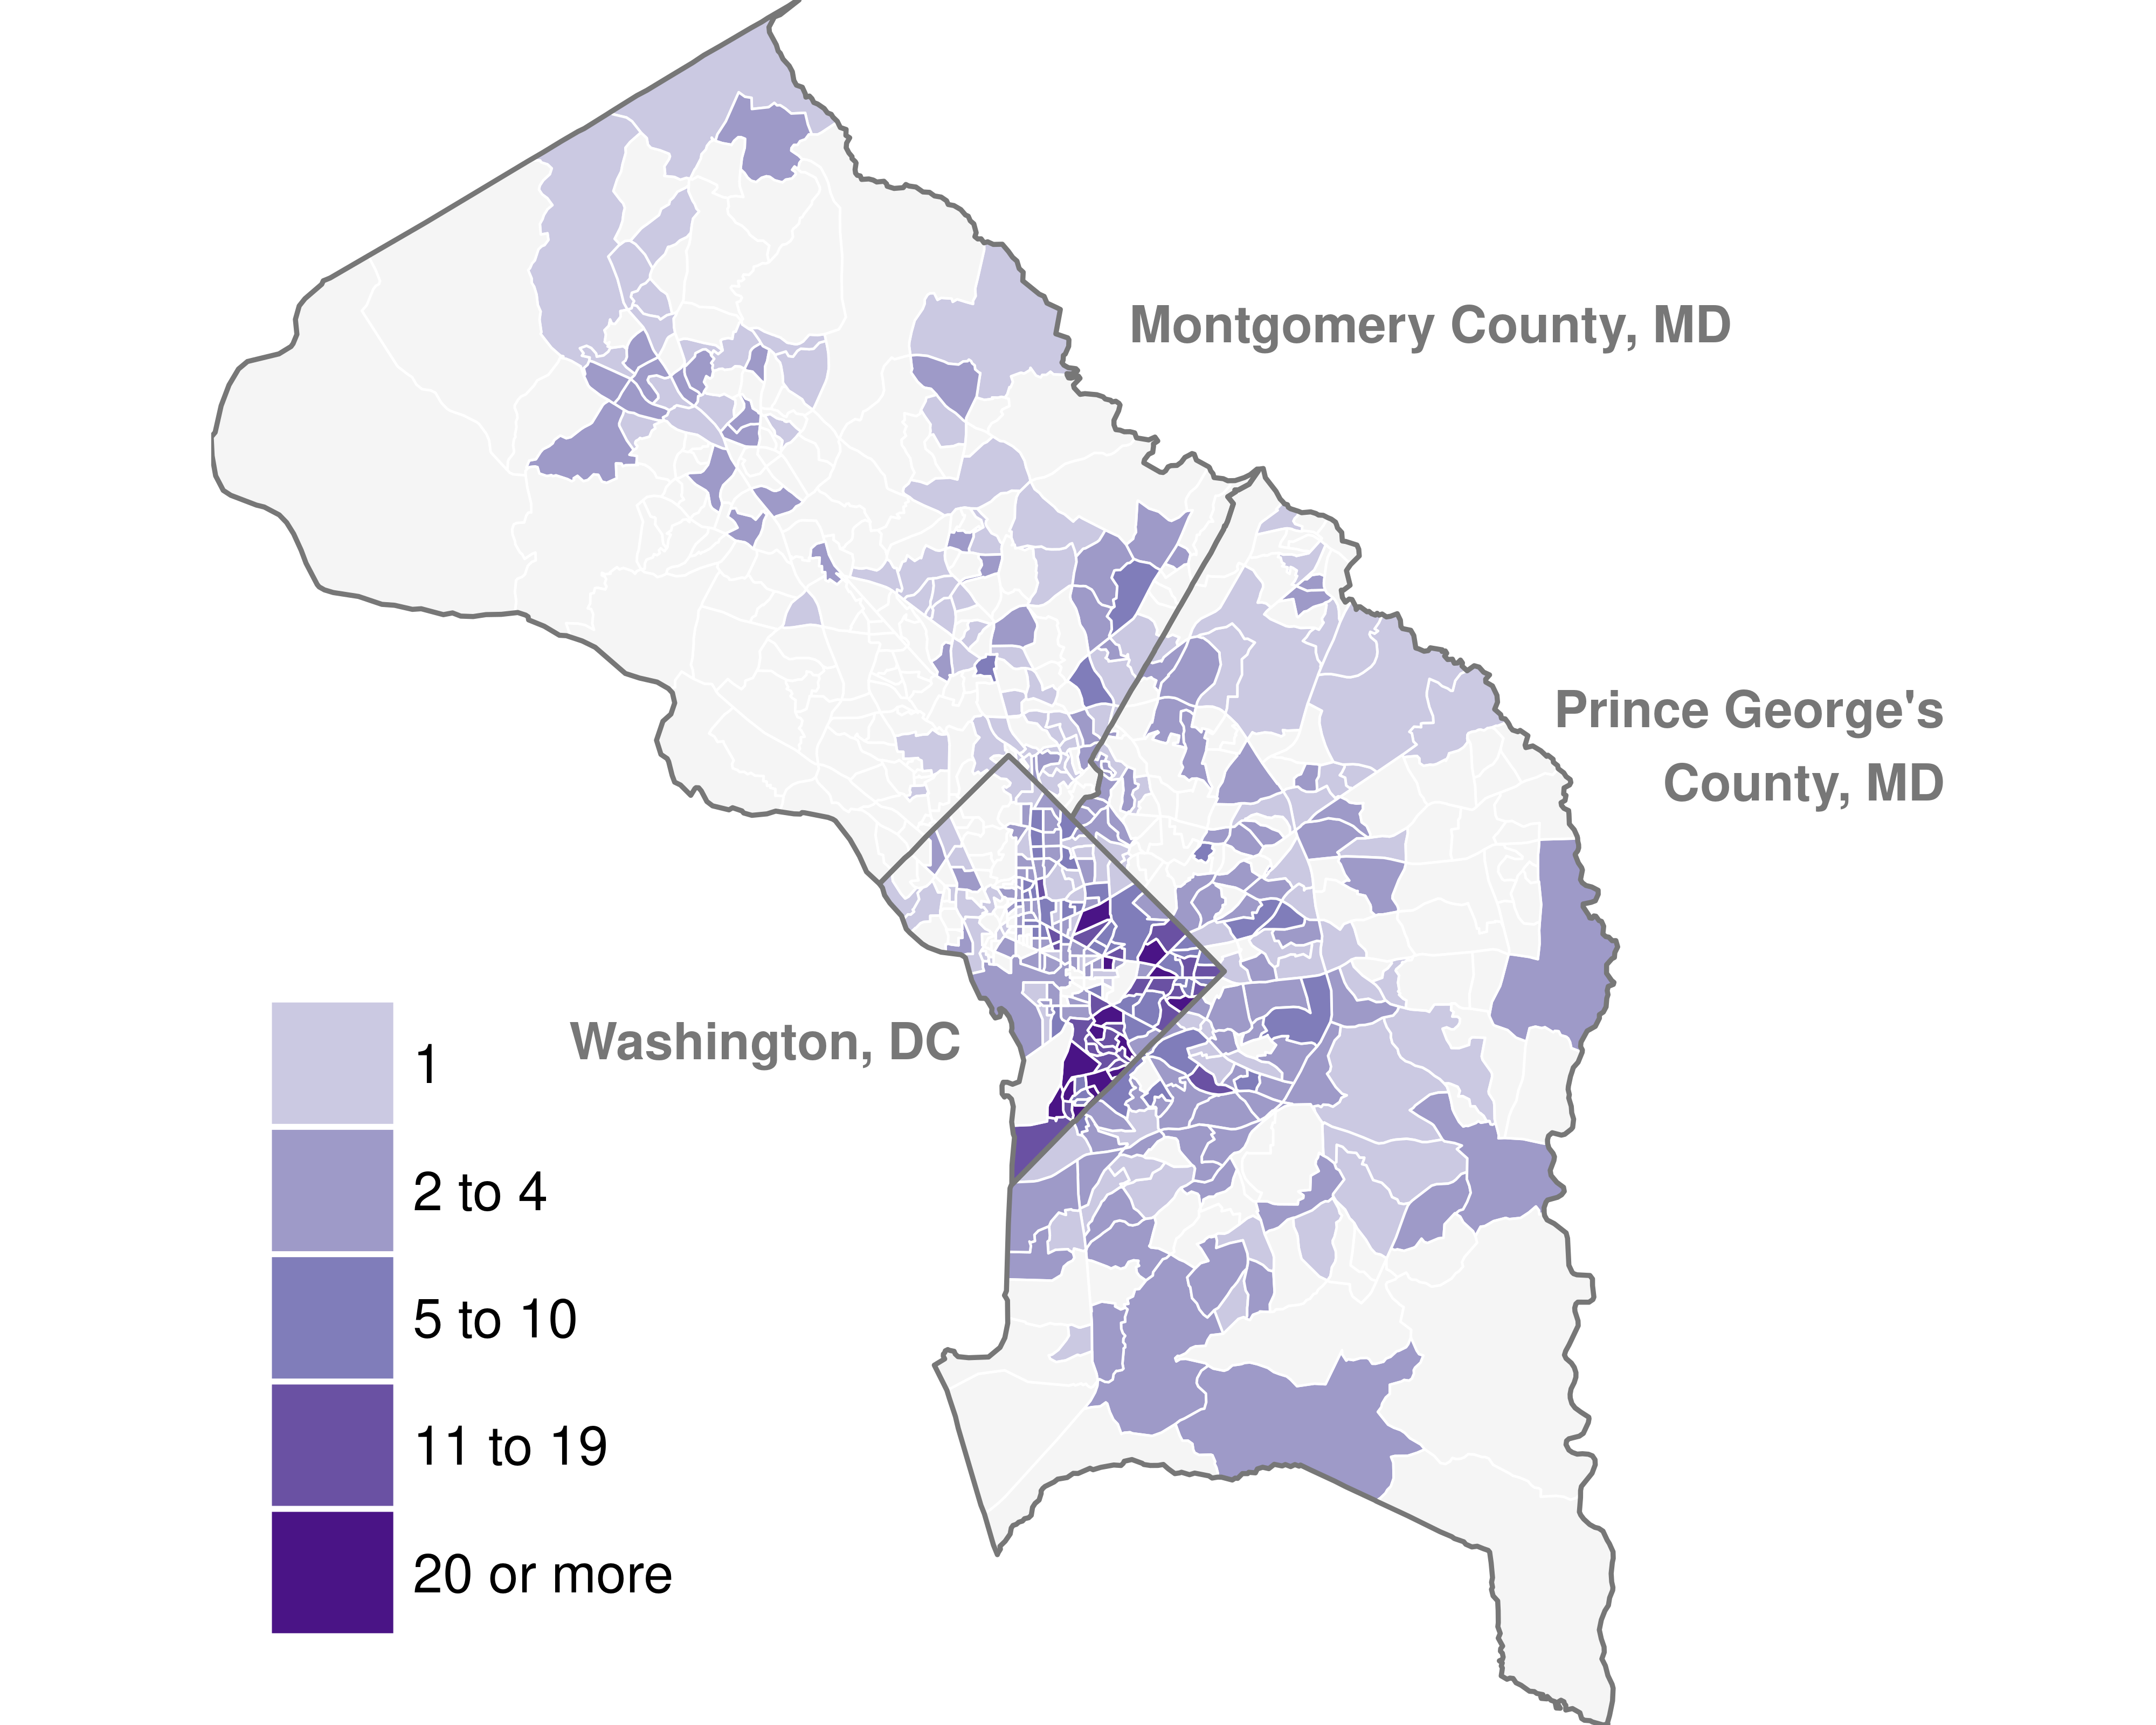
Source: DC Open Data, 2017-2023. Prince George’s County Open Data, 2017-2023. Montgomery County Open Data, 2017-2023.
While homicides in the Capital Region reached historic highs around 1990, and are nowhere near those levels now, the last ten years have seen a concerning resurgence in homicides. Nearly of all of these homicides are in the District and, to a lesser extent, Prince George’s County. This increase does not appear to be part of a broader national trend. The latest tumultuous pandemic years appear to have led to further deterioration in those two areas, while the rest of the Capital Region held steady at relatively low homicide rates.