Chapter 2: Police
With a picture of trends in homicide in hand from Chapter 1, we now turn in this chapter to law enforcement and private security staffing in the Capital Region. While federal agencies with large local presence, such as the US Park Police, operate in the region, our focus is on law enforcement services provided by state and local agencies. Many local agencies provide police protection. Figure 2.1 reports an incomplete number of police agencies operating in the Capital Region by jurisdiction, using the most recent complete survey, unfortunately from 2008.1 The District is covered by four local police agencies: the Washington Metropolitan Police Department, Washington Metropolitan Area Transit Authority Police, University of the District of Columbia Police and District of Columbia Housing Authority Police. Many other agencies, such as George Washington and Georgetown police, operate as well, but the law enforcement census on which we rely does not count them; we do not understand exactly why.
In Maryland and Virginia, local police services are provided by a combination of municipal and county agencies. While some towns offer their own police services, other towns are covered by the county sheriff’s office. For example, Prince George’s County has the largest number of police agencies at thirty. Montgomery County has the second largest, with seven, followed by Fairfax County, which has six agencies.
Figure 2.1: Many Different Police Agencies Operate in the Capital Region.
Police agencies in Capital Region, 2008.
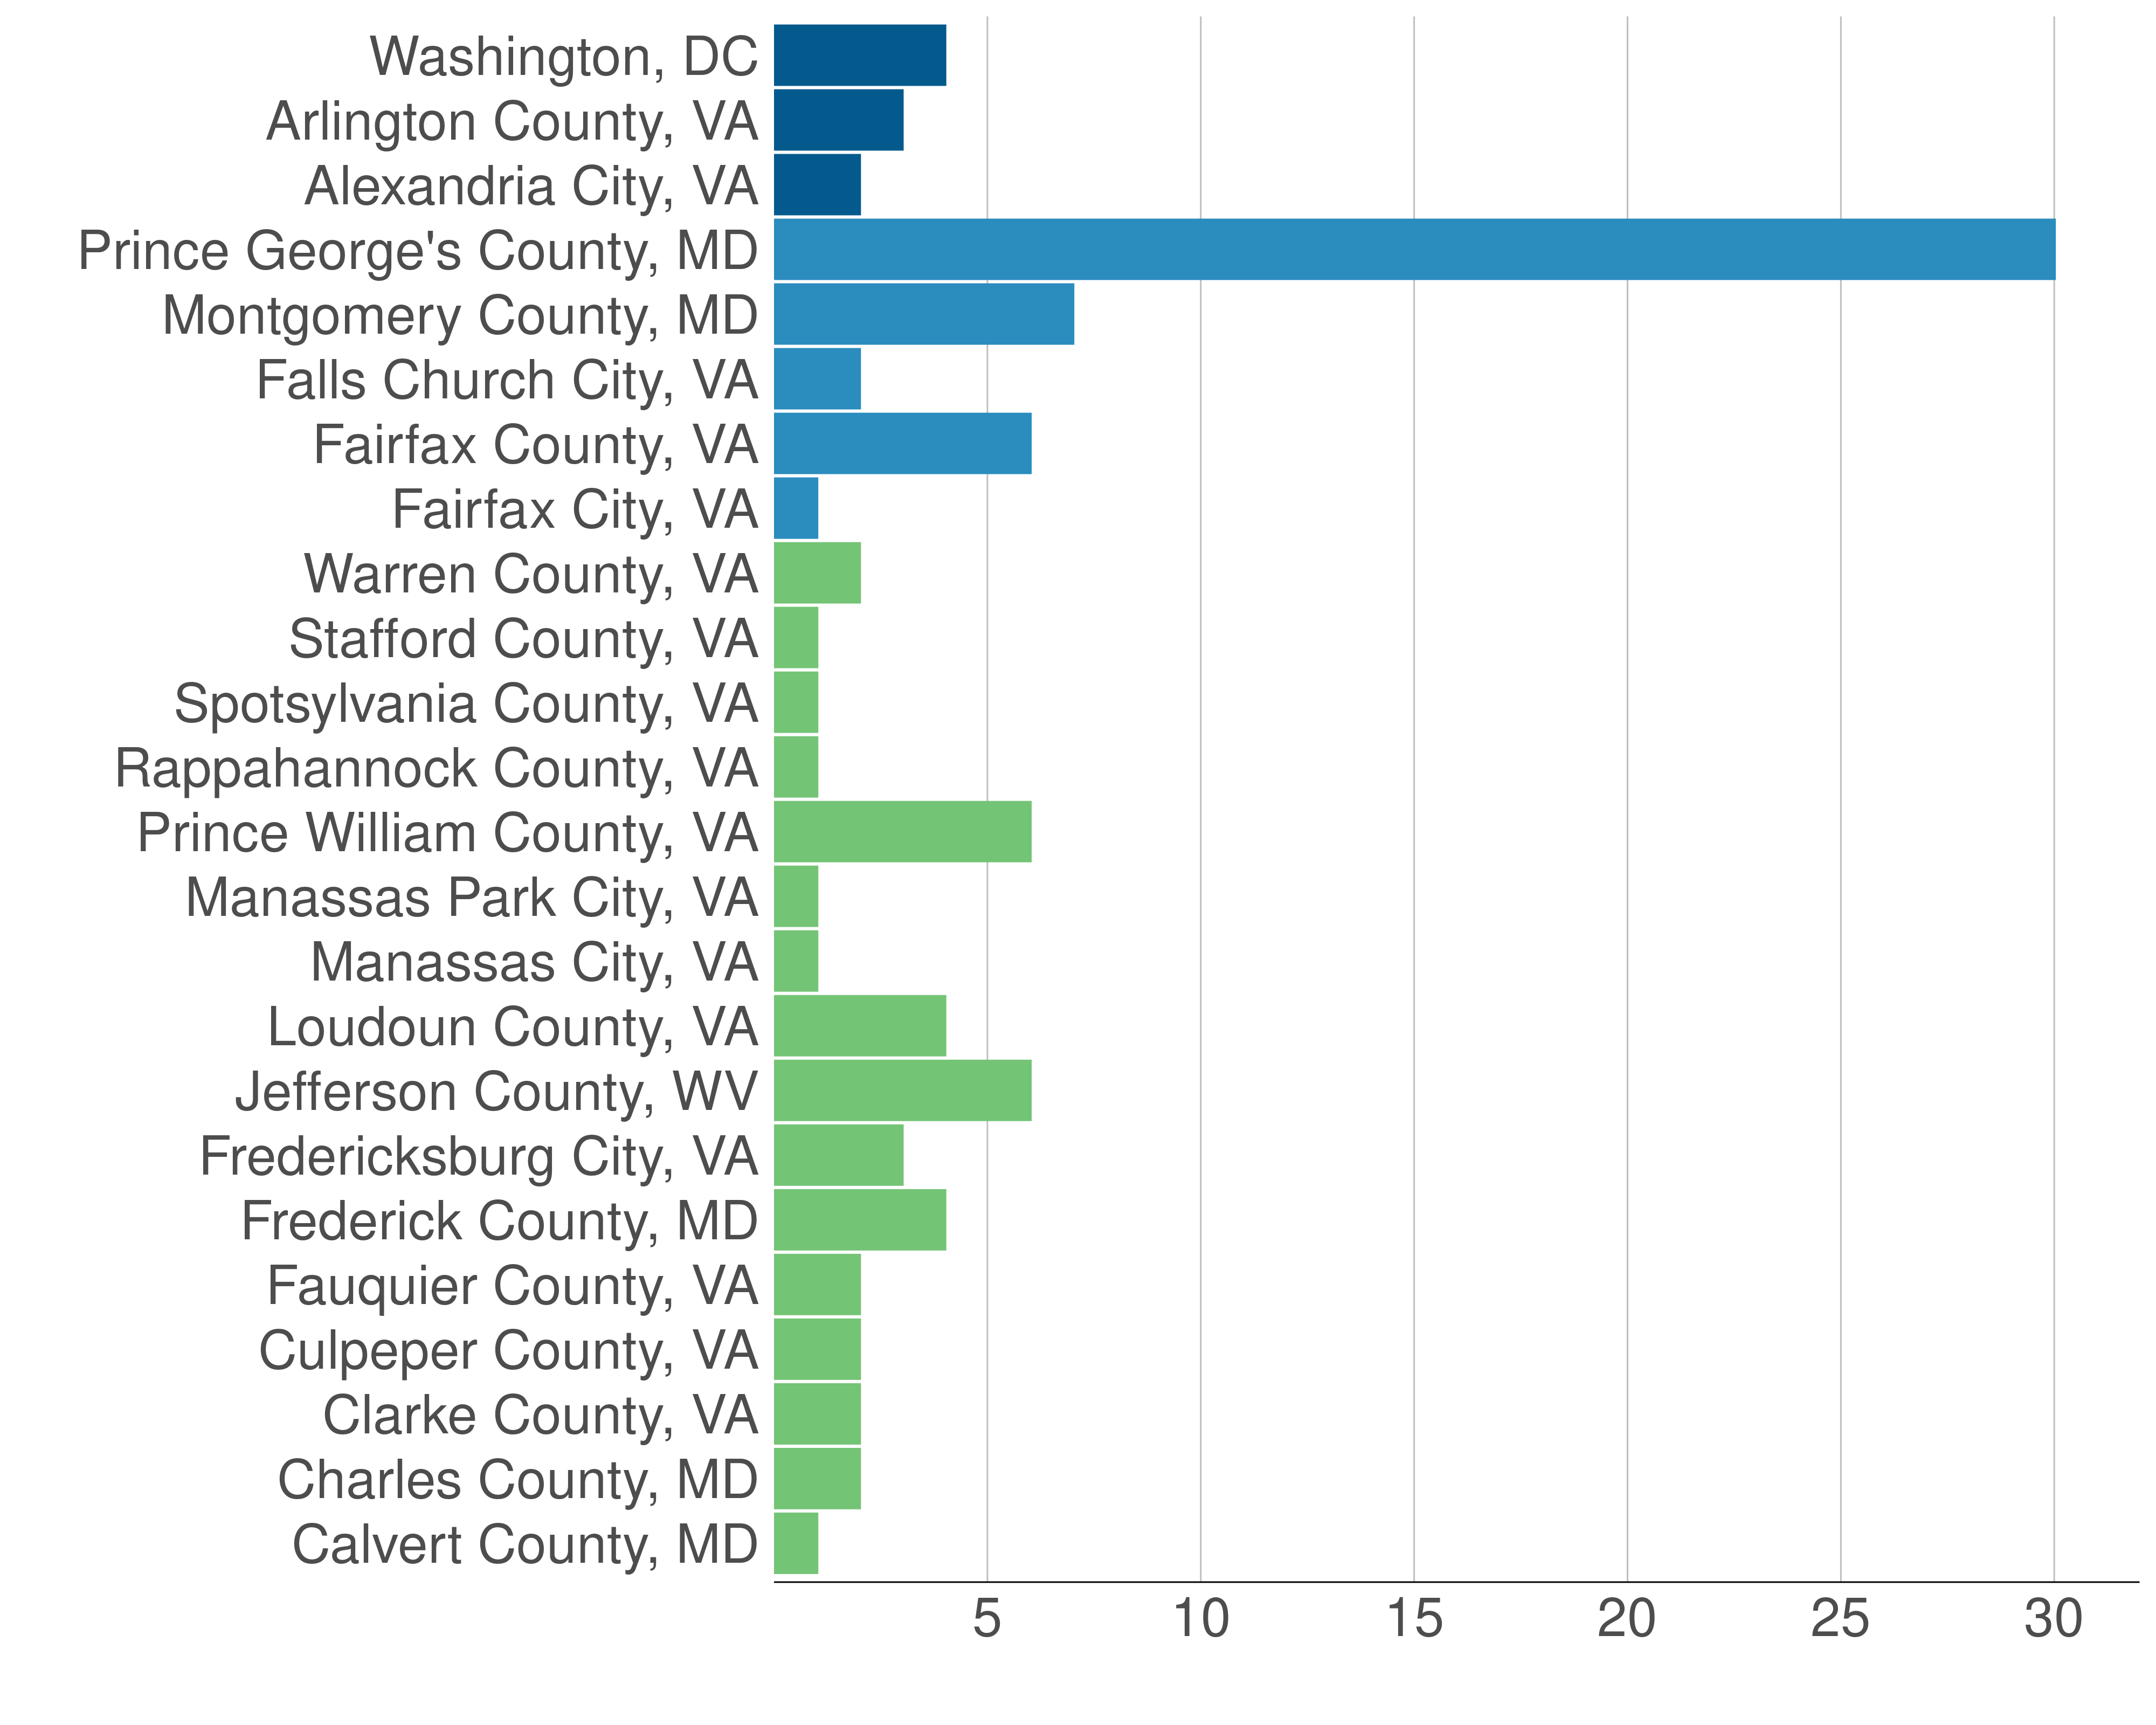
Source: CSLLEA, 2008. Urban jurisdictions in dark blue, suburban jurisdictions in light blue, and exurban jurisdictions in light green.
Shifting to spending, Figure 2.2 reveals that since the 1970s, the District has consistently spent more per capita on police than other Capital Region jurisdictions. Using 2021 dollars, from 1967 to 2017 (the most recent available year), current expenditures—expenditures for wages and salaries, but not for capital equipment such as cars or buildings—in the District exceeded $1,000 per capita. In contrast, the city of Alexandria is second in per capita expenditures and spent approximately $350 less than the District in 2017.
Figure 2.2: Police Spending Gradually Increases in Most Jurisdictions Through 2017.
Police protection expenditure per capita from 1967 to 2017, largest Capital Region jurisdictions, 2021 dollars.
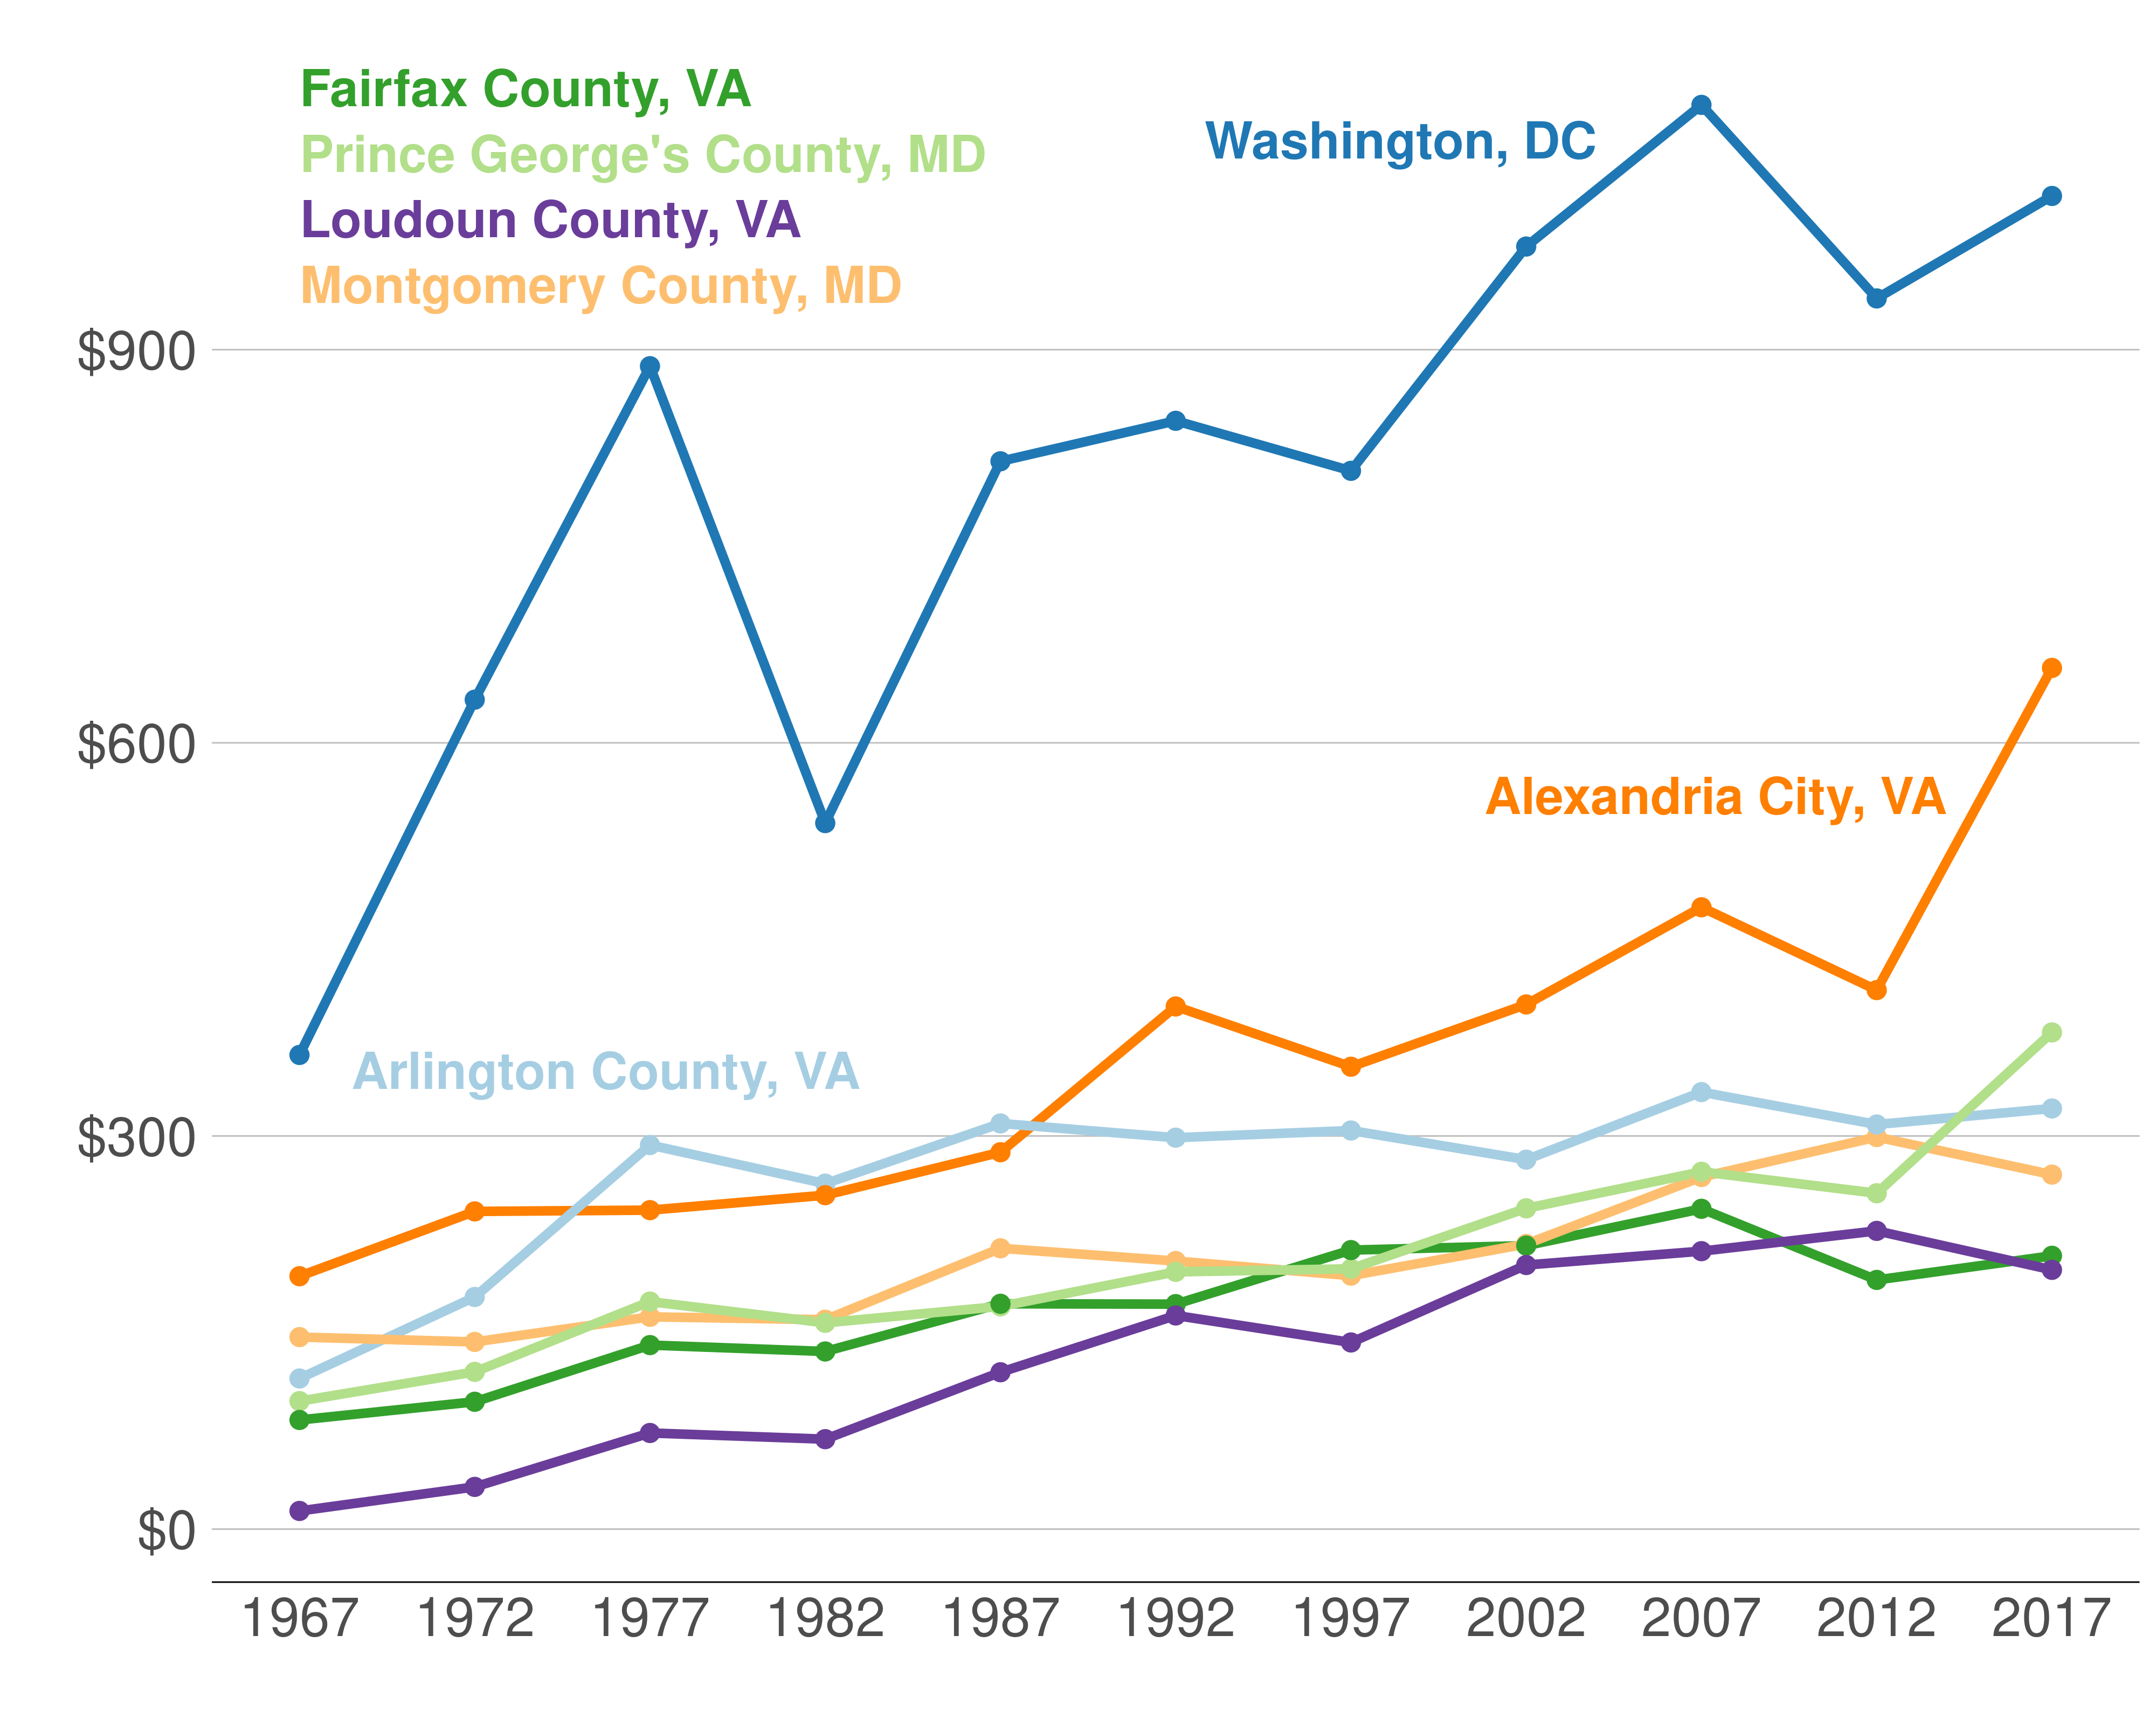
Source: The Government Finance Database, 1967-2017. We use data in years ending in 2 and 7 when the data are most complete. We use current expenditures and do not include capital expenditures. All numbers are in 2021 dollars.
Much of what police expenditures deliver is police officers. Figure 2.3 compares police staffing across the Capital Region by presenting police staffing per 100,000 residents. The District’s Metropolitan Police Department, at about 625 officers per 100,000 residents, has the highest staffing (about 4,000), and is also the largest department.2 As of 2021, the MPD has more than twice the number of police officers per capita of any other Capital Region jurisdiction. Charles County Sheriff’s Office (one of the smallest departments in total staffing) has the second-highest staffing level per one hundred thousand residents, or roughly the same staffing per capita as the Alexandria Police Department.
Figure 2.3: Police Staffing Decreasing in the District, Mostly Flat Elsewhere in the Capital Region.
Police staffing per 100,000 residents, 1975 to 2021, largest Capital Region police departments.
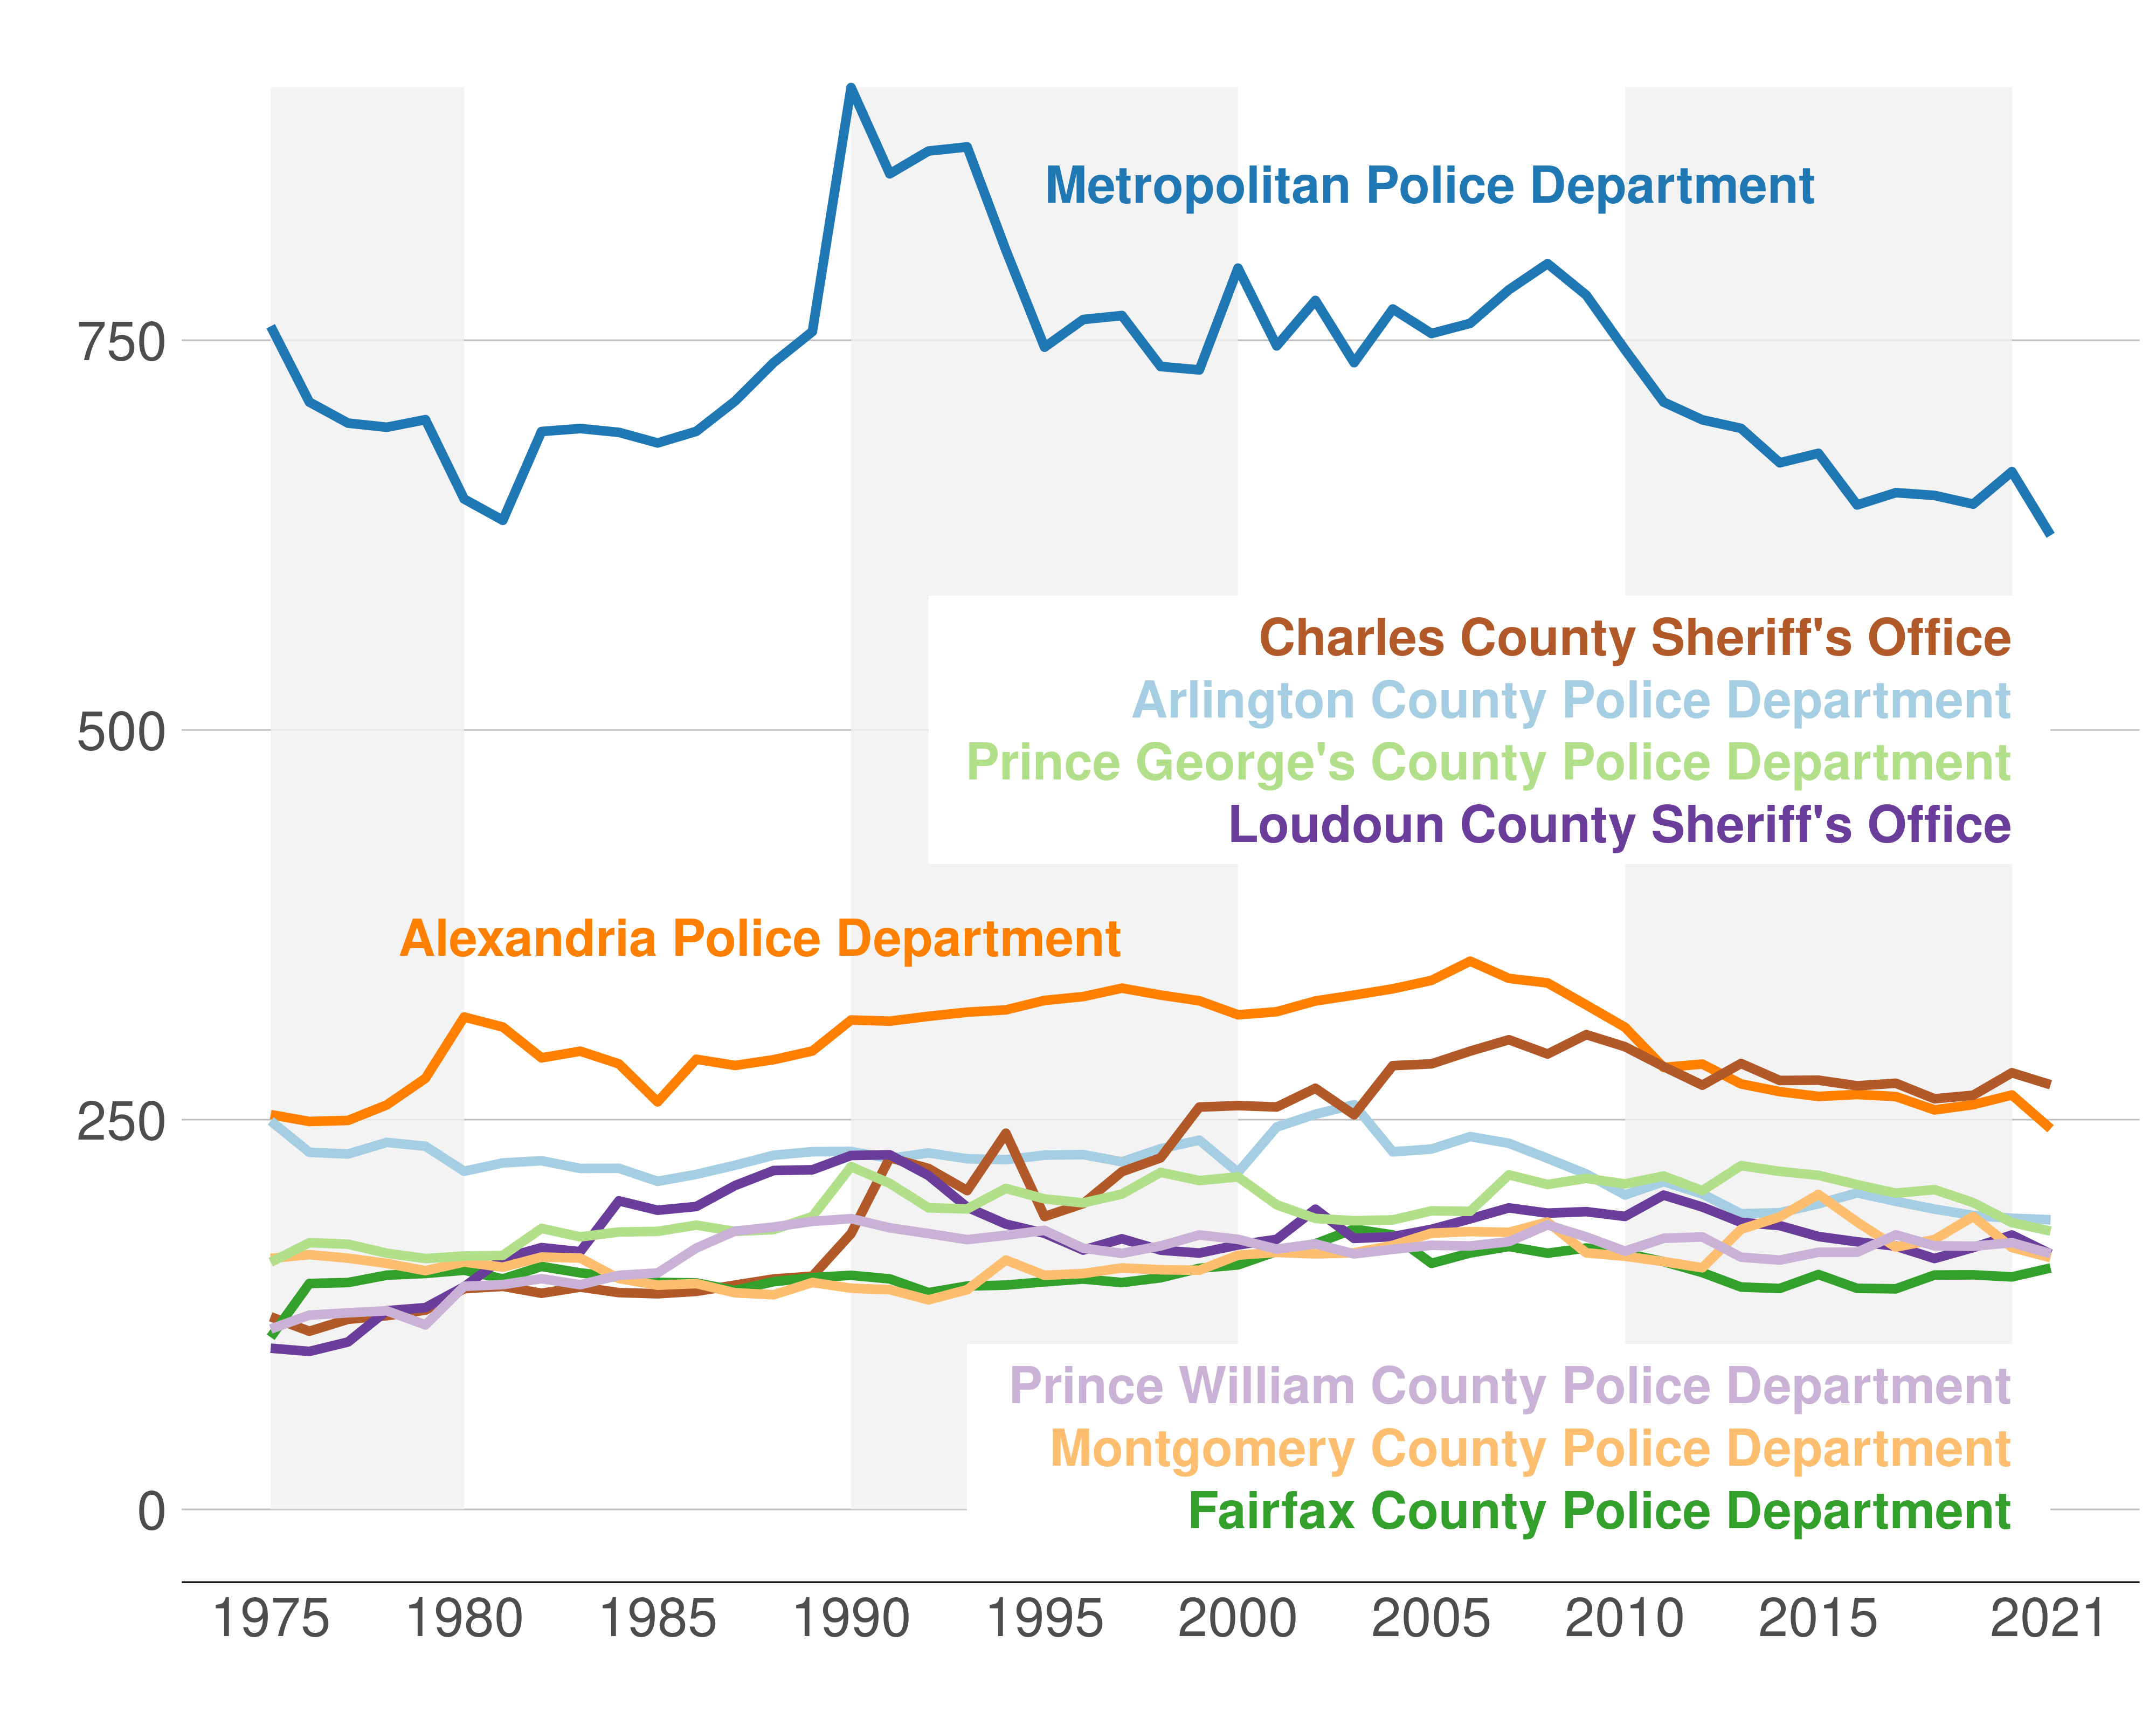
Source: LEOKA, 1975-2021. US Census Bureau’s County Intercensal Datasets, 1970-1979. US Census Bureau’s County Intercensal Tables, 1980-1989. US Census Bureau’s State and County Intercensal Tables, 1990-1999. PEP, 2000-2019. US Census Bureau’s County Population Totals and Components of Change, 2020-2022. We choose police departments with the largest total staff in 2021.
Are private security officers an important part of this crime reduction puzzle? As of 1999, for every two employed private security guards, there was slightly more than one employed police officer. Since then, regional growth in police officers has outstripped growth in private security. Starting with 1999 as 100 percent, Figure 2.4 shows the number of police officers and the number of private security employees relative to 1999. In 2022, the Capital Region has 20 percent more police officers than in 1999, and 10 percent more private security guards.
Figure 2.4: Police Officer Growth Outstrips Private Security Growth.
Police and private security employment growth rate from 1999 to 2022 (excluding 2017).
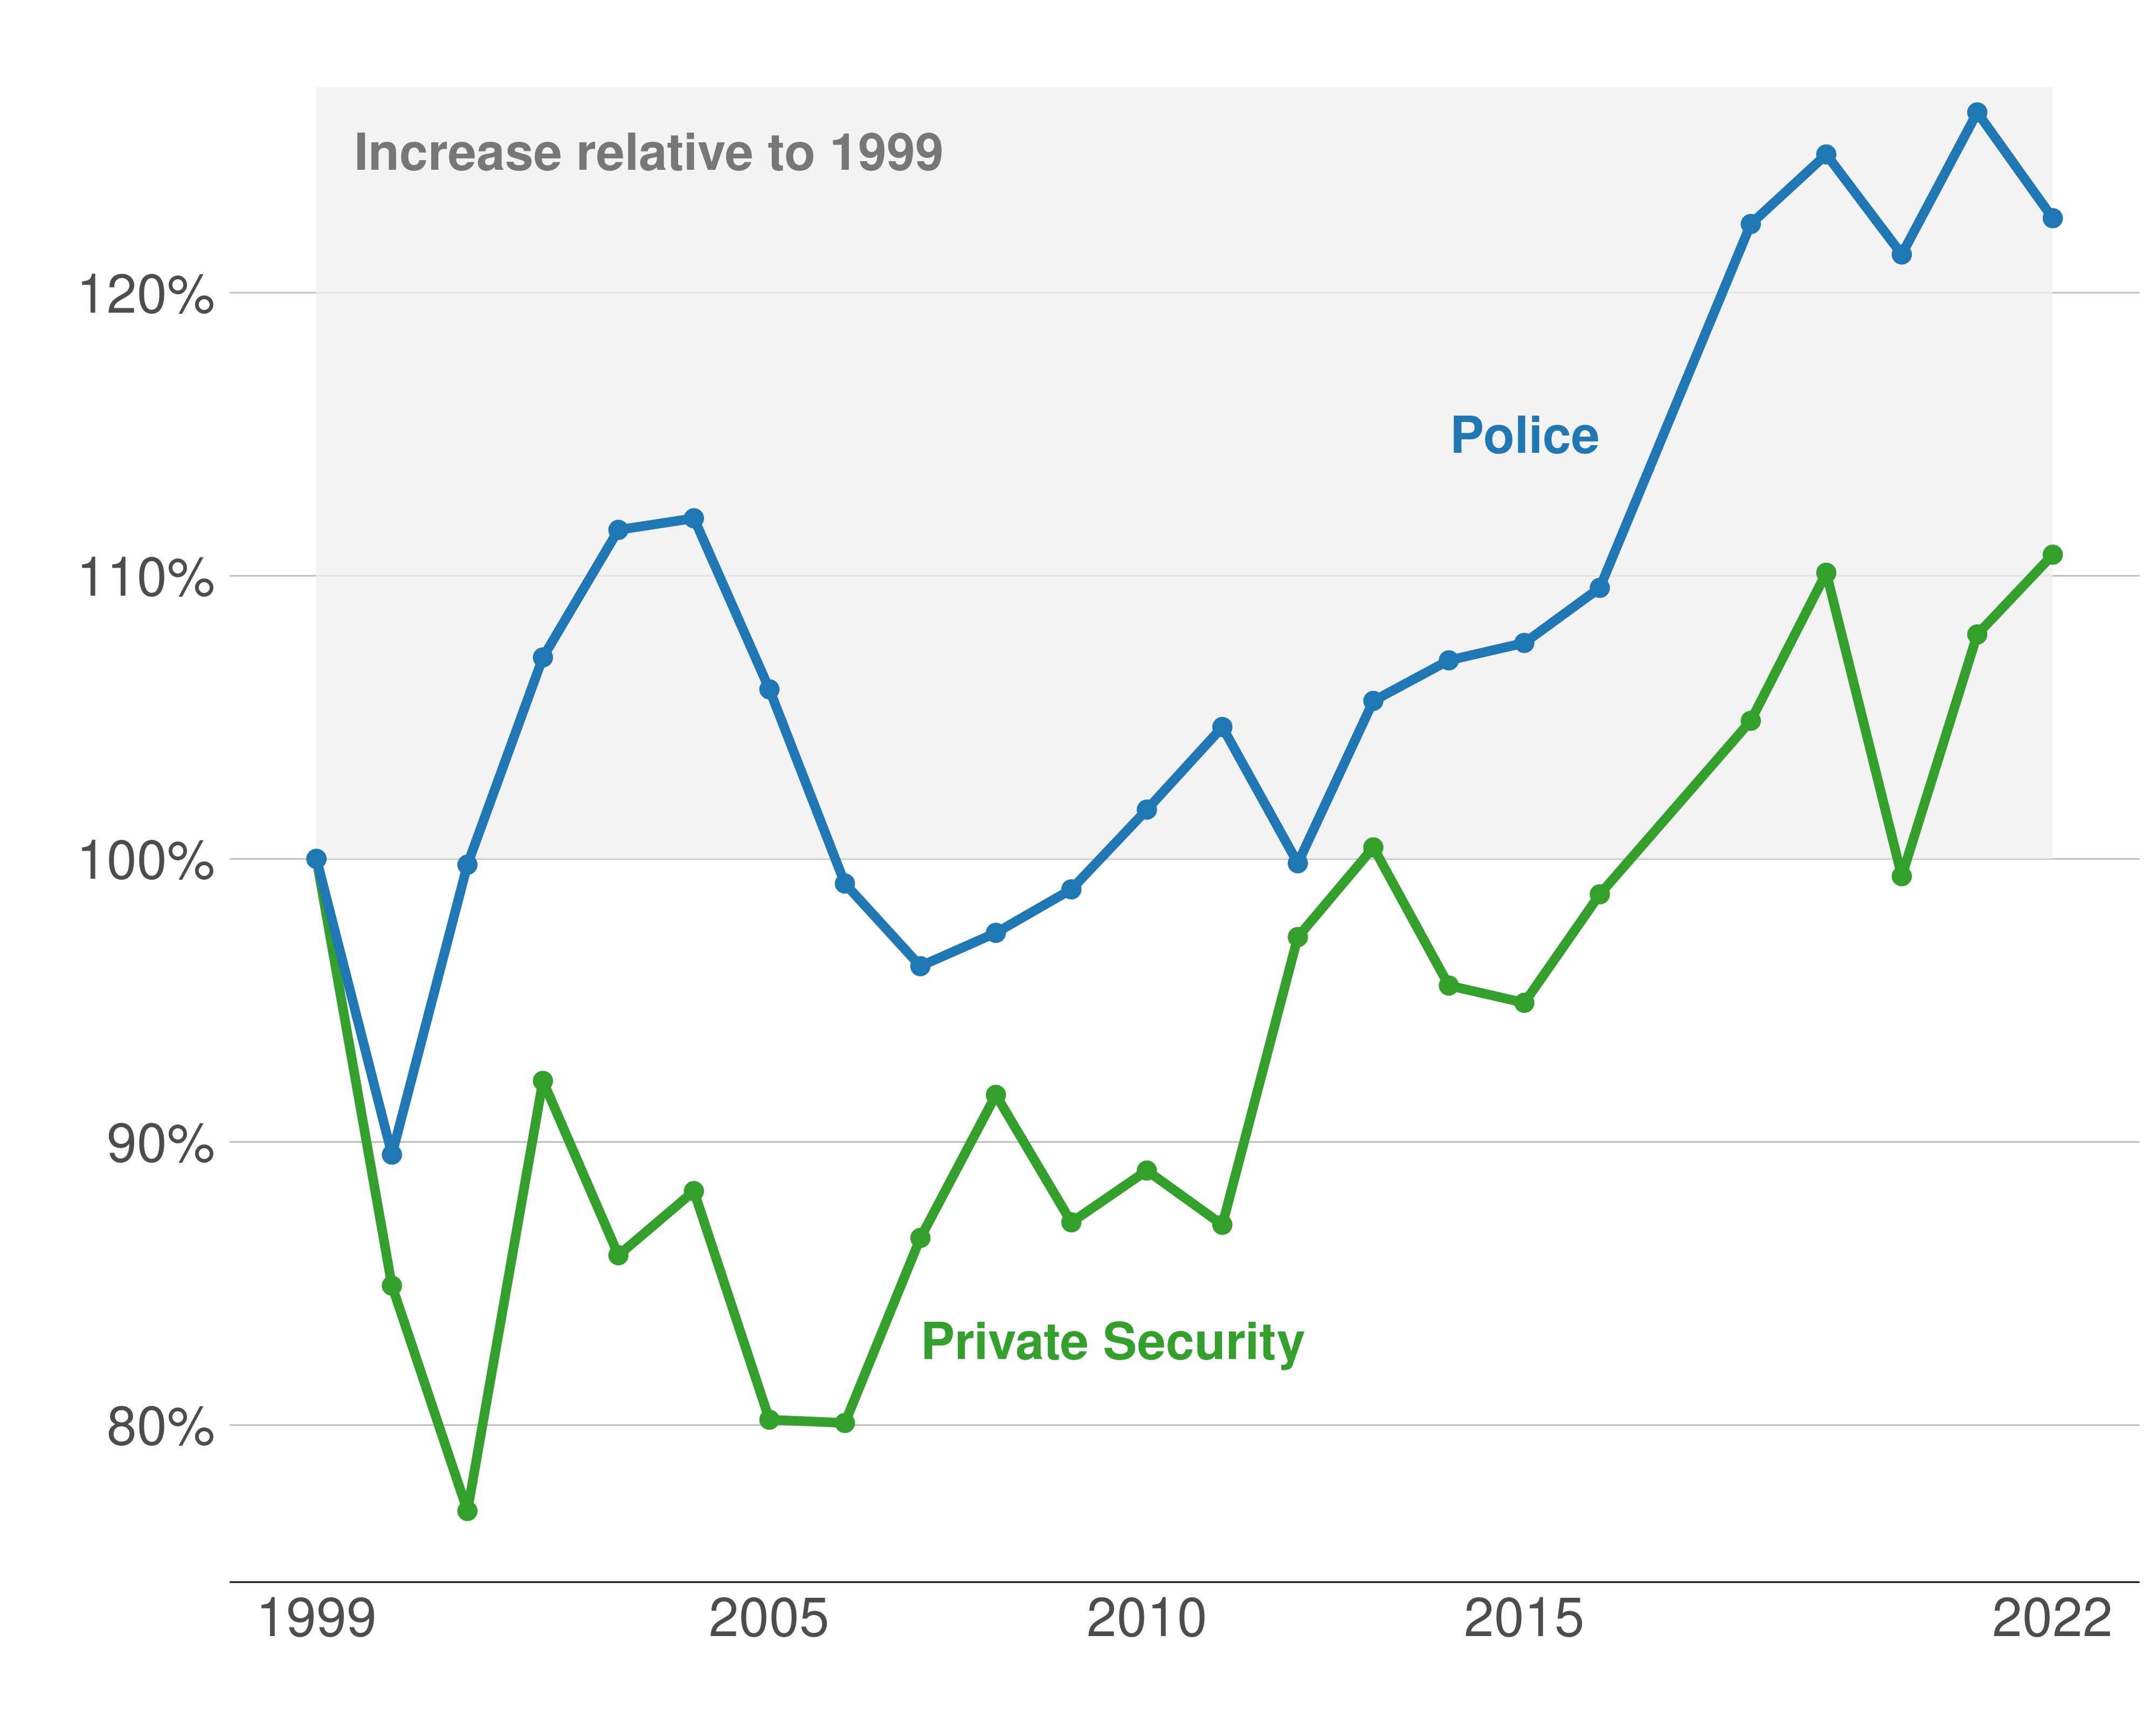
Source: BLS OEWS, 1999-2022. The “Police” line includes (i) First-Line Supervisors of Police and Detectives, (ii) Detectives and Criminal Investigators, and (iii) Police and Sheriff’s Patrol Officers.
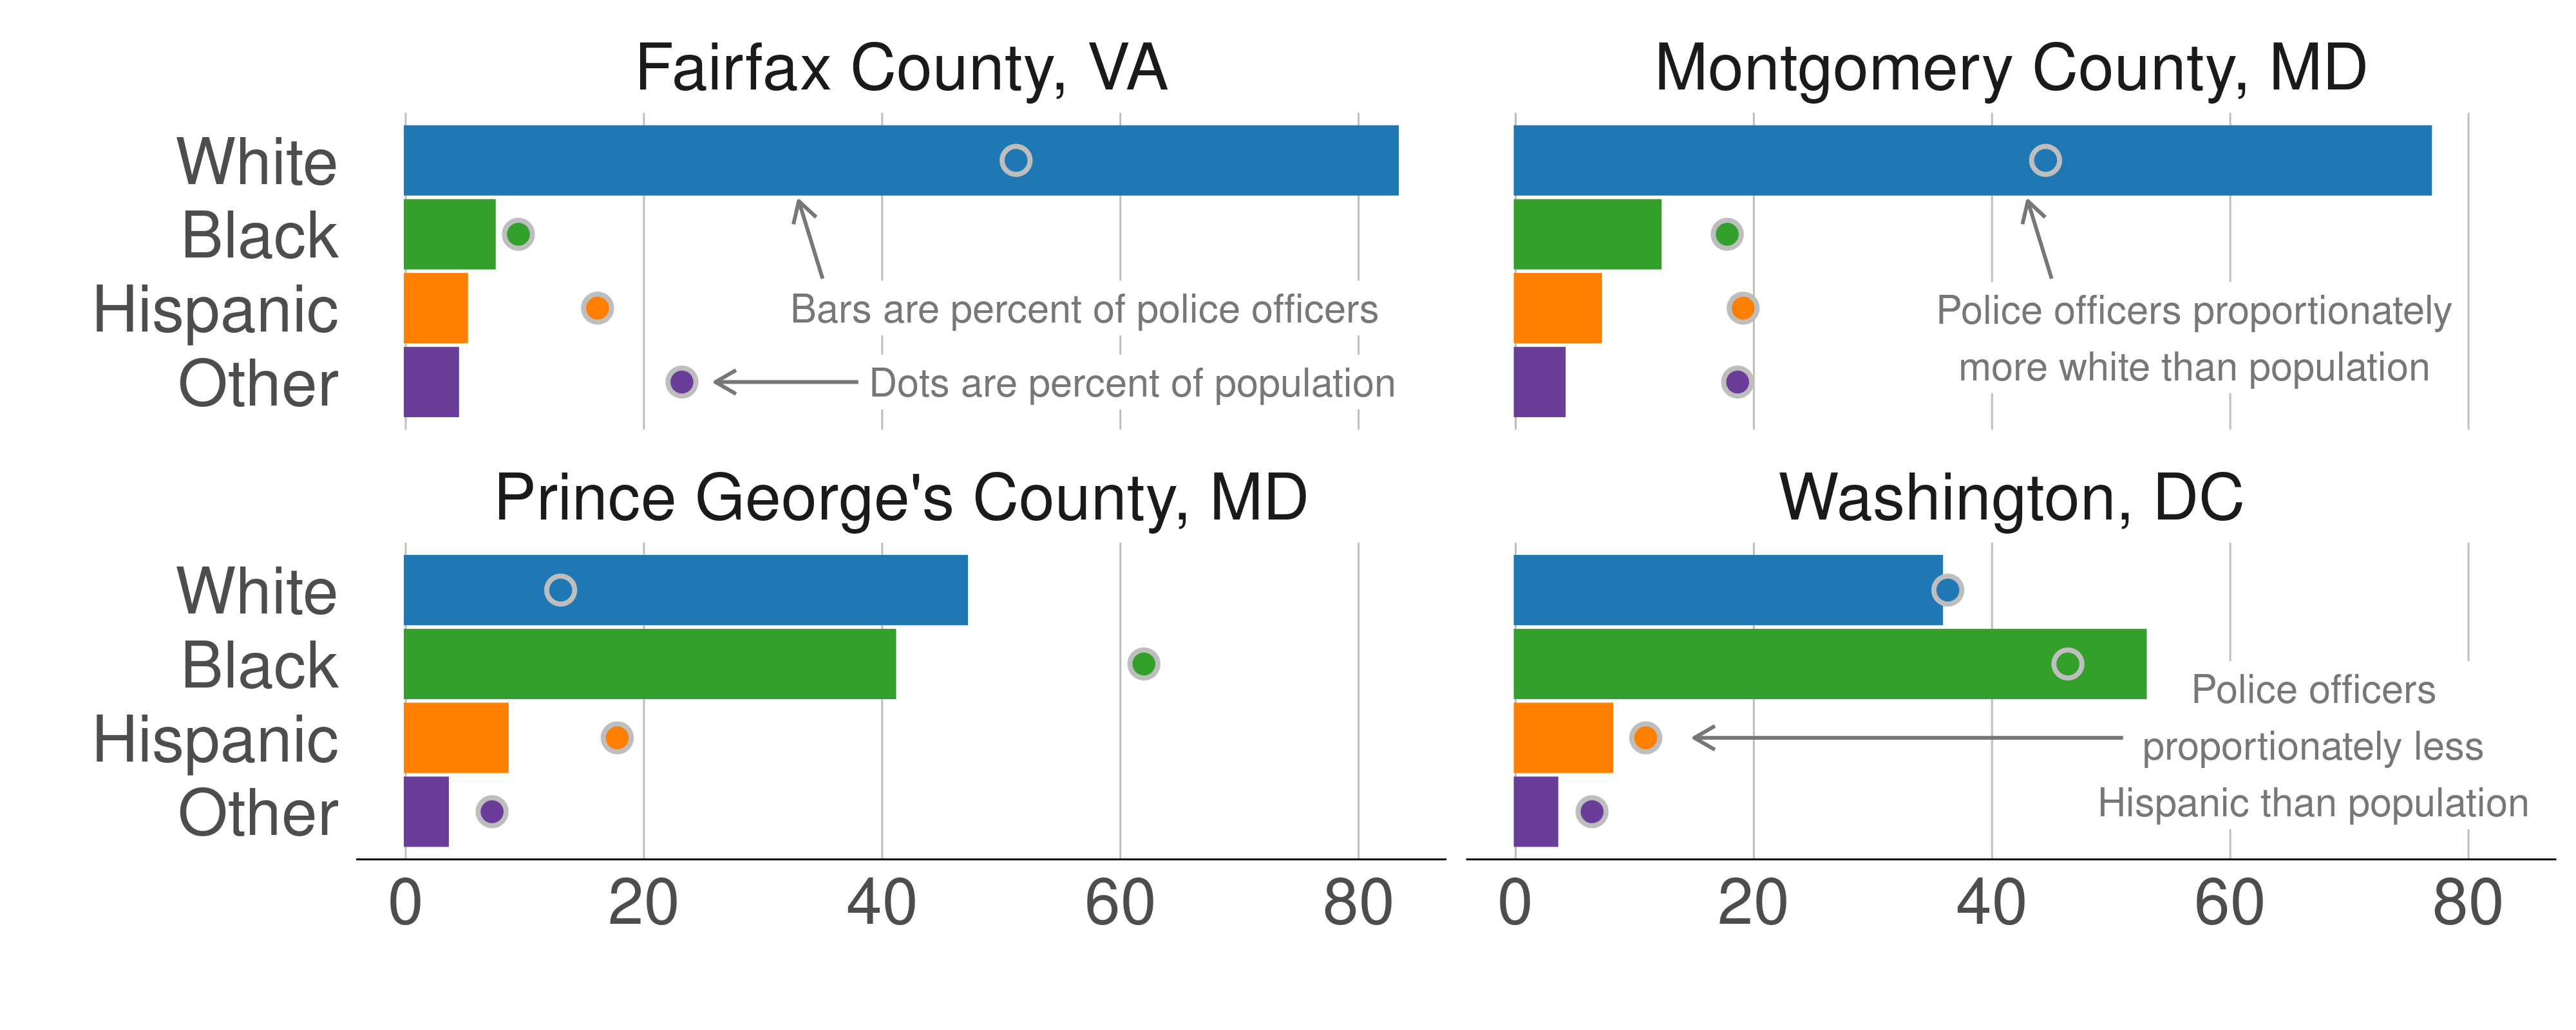
We conclude by looking at whether police officer demographics match the communities that they represent. Figure 2.5 shows the racial make-up of regional police agencies with bars, and the racial make-up of the population with dots. In all four counties we analyze—Fairfax, Prince George’s, and Montgomery counties along with the District—Hispanics are underrepresented on police forces.
The remaining representation picture is mixed. Fairfax County has the highest percentage of White public safety employees at over eighty percent, while Whites make up only about half of the county population. In Montgomery and Prince George’s counties, Whites are overrepresented on the police force when compared to their percentage of the population. Blacks are overrepresented on the District police force, but are underrepresented in the remaining counties.
Figure 2.5: Capital Region Police Forces Sometimes Racially Representative of Population They Serve.
Racial percentage of police force (bars) versus racial percentage of population (points) in 2016.